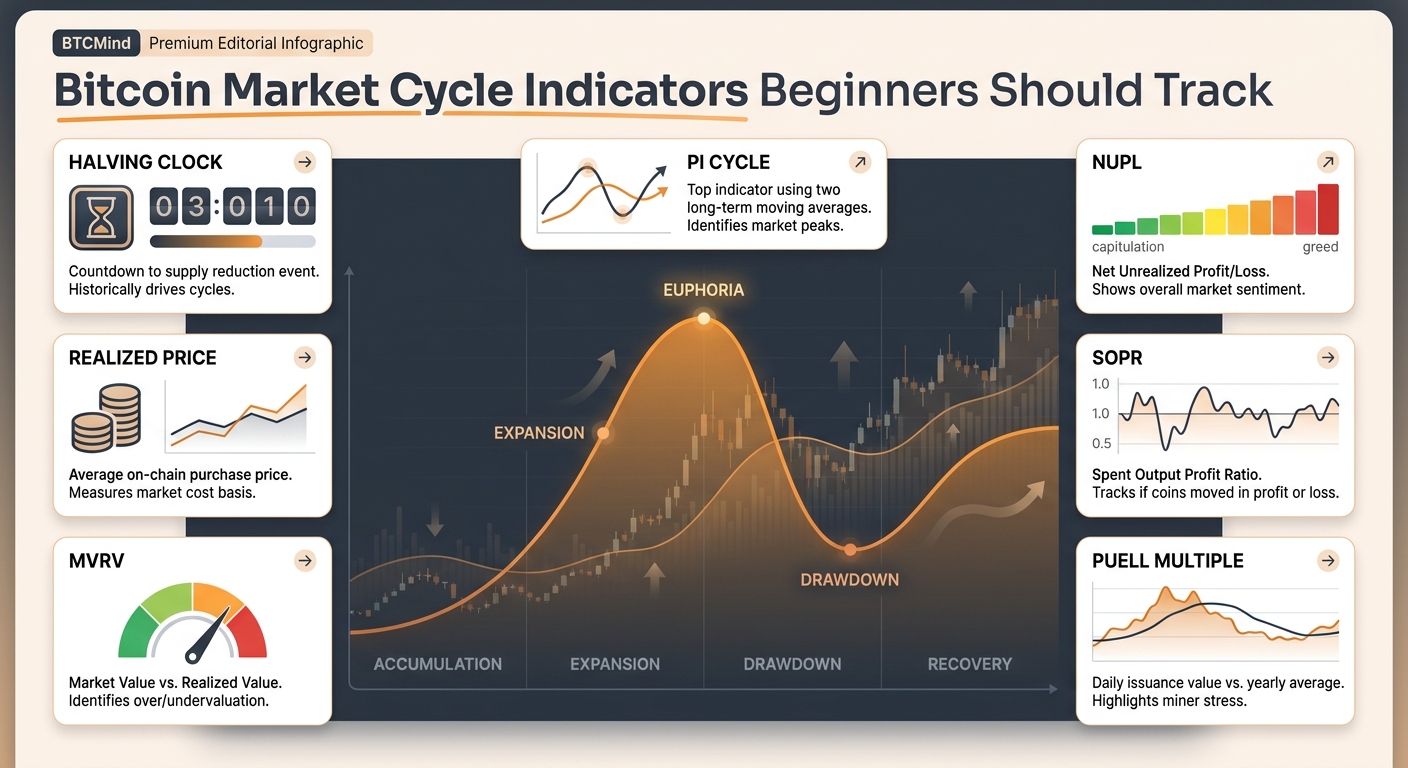
If you are trying to understand Bitcoin without reacting to every candle, the right place to start is a short list of Bitcoin market cycle indicators. Most beginners make the same mistake: they look for one magic chart that will call the exact top or bottom. That is not how cycle work usually works. Useful Bitcoin market cycle indicators help you build context. They do not remove uncertainty.
The better approach is to stack a few signals that answer different questions:
- Is Bitcoin historically expensive or cheap?
- Are holders taking profits or capitulating?
- Are miners under stress?
- Is price being driven by spot demand or leveraged futures?
- Are conditions starting to look euphoric?
That is why the best Bitcoin market cycle indicators are not only price tools. They also include on-chain valuation, miner behavior, holder profit-taking, and leverage conditions.
Risk note: This article is educational only. It is not investment advice, and no indicator can guarantee a top, bottom, or future return.
What a Bitcoin market cycle actually means
A Bitcoin market cycle is the broad pattern of accumulation, expansion, euphoria, drawdown, and recovery that tends to play out over multiple years. Fidelity's February 10, 2026 explainer on four-year Bitcoin cycles notes that people often link the pattern to halvings, monetary policy, and investor psychology, while also warning that future cycles may not look exactly like the past.
For beginners, that is the right mental model. A cycle is a framework, not a script. The goal of Bitcoin market cycle indicators is not to predict the future with certainty. The goal is to tell you whether risk conditions look historically stretched, historically washed out, or somewhere in between.
The beginner stack: 8 Bitcoin market cycle indicators worth tracking
| Indicator | What it measures | What beginners should look for | Main limitation |
|---|---|---|---|
| Halving clock | Where Bitcoin sits in its supply cycle | Use it as long-term context, not a timing trigger | Every cycle can differ in timing and intensity |
| Realized Price | Average on-chain cost basis of coins moved on-chain | Price far below realized price has historically aligned with deeper stress | It is slow and not designed for short-term entries |
| MVRV Ratio | Market cap vs. realized cap | High readings can suggest overheating; lower readings can suggest compression | It can stay elevated for long periods in bull markets |
| MVRV Z-Score | How far market value deviates from realized value on a standardized basis | Extremes have historically aligned with major tops and deep undervaluation zones | It is a historical context tool, not a standalone trigger |
| NUPL | Aggregate unrealized profit or loss | Rising unrealized profit can signal growing optimism; extremes can warn of complacency | Sentiment can remain euphoric longer than expected |
| SOPR | Whether coins spent on-chain are moving at profit or loss | Persistent profit taking can show strength; breakdowns below 1 can show stress | Choppy periods create noisy reads |
| Puell Multiple | Miner revenue vs. its yearly average | Very low miner revenue can mark miner stress and capitulation zones | It says more about miners than immediate price direction |
| Pi Cycle Top | Relationship between fast and slow moving averages | Treat it as a late-cycle warning, not an exact sell button | It is built for tops and offers little help in the middle of a cycle |
This table is the simplest way to think about Bitcoin market cycle indicators. Some measure value, some measure behavior, and some measure late-cycle heat. You get more reliable context when they agree than when you stare at only one chart.
1. Start with the halving clock
Every beginner guide to Bitcoin market cycle indicators should start with the halving, because it is the cleanest structural event in Bitcoin. The block subsidy is cut roughly every four years, reducing new supply issuance. Fidelity's cycle explainer argues that this recurring supply shock is one reason many investors still anchor cycle discussions around a four-year rhythm.
The mistake is treating the halving like an alarm clock for instant upside. A halving is better used as a backdrop:
- Early post-halving periods often attract more cycle attention.
- Late-cycle enthusiasm can arrive well after the halving.
- Macro liquidity, ETF flows, regulation, and leverage can still change the path.
So the halving belongs in your stack of Bitcoin market cycle indicators, but only as the slowest layer of context.
2. Use realized price as your reality check
Glassnode defines Realized Price as the ratio between realized capitalization and current supply, which makes it a way to estimate the average price the market paid for the current coin supply. For beginners, that translates into a simple question: is spot trading far above or far below the market's aggregate cost basis?
Why it matters:
- Price well above realized price usually means holders as a group are sitting on profits.
- Price near or below realized price has historically shown stress and tighter risk conditions.
- Realized price forces you to think in terms of cost basis instead of hype.
Among Bitcoin market cycle indicators, realized price is one of the easiest ways to avoid emotional reading. It is not flashy, but it gives you a long-term anchor.
3. Track MVRV Ratio for valuation pressure
Glassnode defines the MVRV Ratio as market cap divided by realized cap. In plain English, it compares what Bitcoin is worth at today's market price with the value implied by the prices at which coins last moved on-chain.
That makes MVRV one of the core Bitcoin market cycle indicators for beginners:
- A high MVRV Ratio suggests the market is carrying a large unrealized profit cushion.
- A lower MVRV Ratio suggests profit cushions have compressed.
- Sharp moves in MVRV often matter more than isolated single-day readings.
The limitation is important. High MVRV does not automatically mean "sell now." Bull markets can stay expensive longer than people expect. That is why MVRV should be paired with other Bitcoin market cycle indicators like SOPR, NUPL, and Pi Cycle Top.
4. Add MVRV Z-Score to spot extremes
If MVRV Ratio is the broad valuation gauge, MVRV Z-Score is the cleaner extreme-detector. Glassnode defines it as the difference between market cap and realized cap divided by the standard deviation of market cap. You do not need the formula memorized. What matters is the use case: it highlights when Bitcoin looks unusually overvalued or unusually undervalued relative to its own history.
For beginners, this is one of the most practical Bitcoin market cycle indicators because it helps separate "expensive" from "historically stretched."
Use it like this:
- Rising into historical extreme zones should increase your caution.
- Falling into historically depressed zones should increase your patience and curiosity.
- Middle-zone readings usually mean the signal is not screaming anything.
MVRV Z-Score is still not enough on its own. It works best when you ask whether other Bitcoin market cycle indicators are telling the same story.
5. Watch NUPL for crowd psychology
Glassnode describes Net Unrealized Profit/Loss (NUPL) as the ratio between unrealized profit or loss and market cap. That makes it a useful crowd-psychology lens. It shows how much paper profit or paper pain the market is carrying at a given moment.
Why NUPL belongs in a beginner stack of Bitcoin market cycle indicators:
- Rising NUPL usually means more of the market is sitting on unrealized profit.
- Extreme profit conditions can create complacency and reflexive selling risk.
- Deep negative readings can reflect exhaustion and capitulation.
NUPL is especially useful because it explains why tops often become unstable. When too many holders are sitting on large unrealized gains, the market becomes more sensitive to profit-taking.
6. Use SOPR to see whether holders are taking gains or accepting losses
Glassnode defines SOPR, the Spent Output Profit Ratio, as the ratio between realized value and value at creation for spent outputs. In practical terms, SOPR tells you whether coins moving on-chain are being sold at a profit or at a loss.
That makes SOPR one of the most behaviorally useful Bitcoin market cycle indicators:
- SOPR above 1 means coins are being spent at profit on average.
- SOPR below 1 means coins are being spent at loss on average.
- Repeated rejection around 1 can reveal whether profit taking is being absorbed or whether weakness is building.
SOPR is noisy in short windows, so beginners should avoid overreacting to one print. But as part of a wider stack of Bitcoin market cycle indicators, it helps confirm whether optimism is still being rewarded or whether stress is spreading.
7. Check Puell Multiple for miner stress
Glassnode says the Puell Multiple examines mining profitability and the way it shapes market cycles by comparing daily coin issuance value in USD with its 365-day moving average. For beginners, the translation is simple: are miners earning far more or far less than usual?
This matters because miners are structural sellers. They produce new supply and must often sell some of it to fund operations. That makes Puell Multiple one of the more useful Bitcoin market cycle indicators for spotting pressure under the surface.
What to watch:
- Very low readings can reflect miner stress and possible capitulation conditions.
- Higher readings can reflect stronger issuance profitability.
- The indicator is better for cycle stress analysis than short-term direction.
Puell Multiple becomes more useful when valuation gauges also look washed out. If several Bitcoin market cycle indicators are signaling stress at once, that is usually more meaningful than a single miner metric alone.
8. Treat Pi Cycle Top as a warning light, not a prophecy
The Pi Cycle Top Indicator is one of the most famous Bitcoin top signals because it is easy to explain and visually dramatic. Glassnode Studio describes it as a relationship between the 111-day simple moving average and two times the 350-day simple moving average. Bitcoin Magazine Pro says the chart has identified prior major cycle tops to within a few days.
That track record is exactly why beginners misuse it.
Pi Cycle Top is best treated as one of the last Bitcoin market cycle indicators you check, not the first:
- It is designed to warn about mature bull-market conditions.
- It does not help much during early or middle-cycle noise.
- It should trigger caution, not blind action.
If Pi Cycle starts flashing while MVRV Z-Score, NUPL, and SOPR also look stretched, that is a much stronger signal than Pi Cycle on its own.
9. Confirm whether spot demand or leverage is driving the move
Not every cycle move is healthy. Glassnode's derivatives documentation includes a Spot to Futures Volume Ratio and funding-rate metrics because leverage conditions matter. For beginners, the key question is whether price is being supported by real spot demand or exaggerated by crowded futures positioning.
This is the most overlooked category of Bitcoin market cycle indicators:
- Rising price with aggressive leverage can unwind violently.
- Positive funding can show that long positions are paying to stay crowded.
- A healthier move usually looks less dependent on one-way speculative leverage.
You do not need a deep derivatives background to use this. You just need to know that overheated leverage can distort the message from other Bitcoin market cycle indicators.
How to combine Bitcoin market cycle indicators without overcomplicating it
The easiest beginner workflow is a four-layer check:
- Cycle backdrop: Where are you relative to the halving?
- Valuation: What do realized price, MVRV Ratio, and MVRV Z-Score say?
- Behavior: What do NUPL and SOPR say about holder profit and stress?
- Heat: What do Puell Multiple, Pi Cycle Top, and leverage conditions say?
If all four layers point in the same direction, the read is stronger. If they conflict, your conviction should usually go down.
That is also where BTCMind's workflow becomes useful. BTCMind does not frame crypto research as a single indicator call. It frames the market as a debate between different evidence streams, with invalidation logic and risk-aware conclusions built into the final brief. That is the correct mindset for Bitcoin market cycle indicators too. You are not searching for certainty. You are weighing evidence.
Common beginner mistakes
Most people get Bitcoin market cycle indicators wrong in predictable ways:
- They expect one metric to call the exact top.
- They ignore leverage and focus only on spot price.
- They treat a historically expensive market as an automatic short.
- They treat a historically cheap market as a guarantee of immediate upside.
- They forget that macro conditions can distort familiar cycle timing.
If you avoid those five mistakes, your use of Bitcoin market cycle indicators will already be better than most retail commentary.
Final take
The best Bitcoin market cycle indicators for beginners are not the loudest ones on social media. They are the ones that answer different parts of the same question:
- Where are we in the supply cycle?
- How stretched is valuation?
- Are holders in profit or pain?
- Are miners under pressure?
- Is leverage making the move fragile?
Track the halving, realized price, MVRV Ratio, MVRV Z-Score, NUPL, SOPR, Puell Multiple, and Pi Cycle Top together. Then use that stack as context, not as a substitute for risk management.
If you want a research workflow that treats Bitcoin like an evidence problem rather than a headline problem, review BTCMind's feature overview, see how the AI agents structure a bull-versus-bear debate, and use the download page to evaluate whether a mobile research brief fits your process.
FAQ
What are the most useful Bitcoin market cycle indicators for beginners?
The most useful Bitcoin market cycle indicators for beginners are the halving clock, realized price, MVRV Ratio, MVRV Z-Score, NUPL, SOPR, Puell Multiple, and Pi Cycle Top. Together they cover supply, valuation, holder behavior, miner stress, and late-cycle heat.
Which Bitcoin market cycle indicators are best for tops?
Pi Cycle Top, MVRV Z-Score, high MVRV readings, elevated NUPL, and overheated leverage conditions are among the more useful Bitcoin market cycle indicators for warning about mature bull markets. None of them can time a top perfectly on their own.
Which Bitcoin market cycle indicators are best for bottoms?
Realized price, low MVRV readings, depressed MVRV Z-Score, negative or washed-out NUPL, weak SOPR, and miner-stress signals like low Puell Multiple are among the more useful Bitcoin market cycle indicators for studying deep drawdowns and recovery zones.
Can Bitcoin market cycle indicators replace risk management?
No. Bitcoin market cycle indicators help you frame context. They do not replace position sizing, invalidation levels, time horizon discipline, or the decision to do nothing when signals conflict.