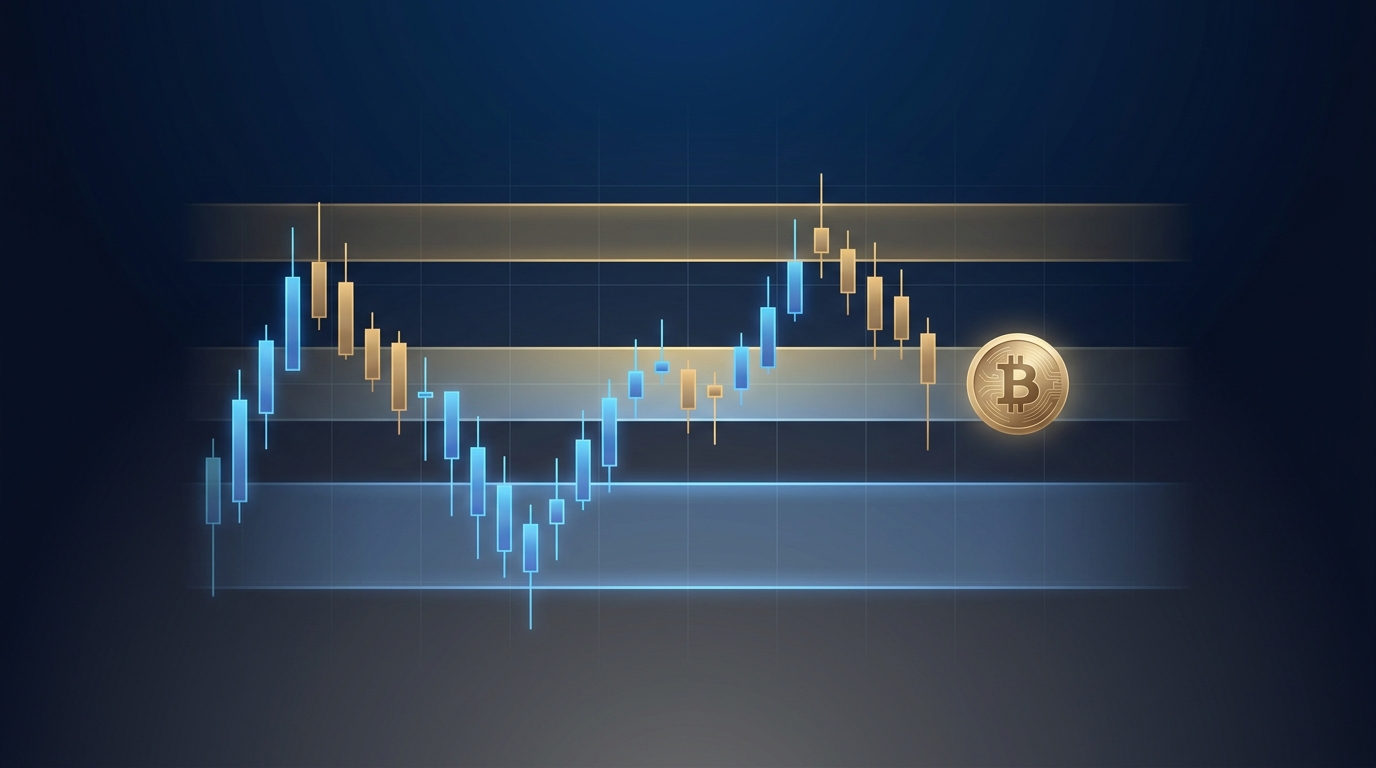
Bitcoin Support and Resistance for Beginners: A 12-Point Zone System
Bitcoin support and resistance are not magic prices. They are areas where the balance between buyers and sellers changed before. That makes them useful places to watch, but not guaranteed places to buy, sell, or predict a reversal.
Most beginner guides explain the definitions and stop there. The harder questions are practical:
- Which reactions are important enough to mark?
- How wide should a zone be?
- Which timeframe should control the decision?
- Does a wick through support count as a breakdown?
- When is a breakout confirmed rather than merely attempted?
- Where is the idea invalidated?
This guide answers those questions with a repeatable workflow. You will build a clean higher-timeframe map, score each Bitcoin support or resistance zone out of 12, write two possible scenarios, and define risk before acting.
Important: This article is educational and is not investment advice, a recommendation, or a live Bitcoin trading signal. Crypto prices can move sharply. Leverage can amplify losses and cause liquidation.
Bitcoin support and resistance in plain English
Support is an area where a decline previously slowed, paused, or reversed because demand increased, supply decreased, or both.
Resistance is an area where an advance previously slowed, paused, or reversed because supply increased, demand decreased, or both.
Fidelity describes support and resistance through the interaction of supply and demand. Charles Schwab similarly teaches traders to look at prior highs and lows, trendlines, and moving averages while treating these tools as interpretive rather than certain.
The most useful beginner mindset is therefore:
A zone is a location for a decision, not a prediction.
| Term | Practical meaning | Common beginner error |
|---|---|---|
| Support | An area where buyers previously defended price | Assuming price must bounce again |
| Resistance | An area where sellers previously capped price | Assuming price cannot break higher |
| Breakout | Price gains acceptance above resistance | Treating one wick as confirmation |
| Breakdown | Price gains acceptance below support | Selling the first move below a line |
| Retest | Price returns to a broken zone from the other side | Assuming every retest must hold |
| Role reversal | Old resistance may become support, or vice versa | Treating the role change as automatic |
| Invalidation | Evidence that makes the original thesis wrong | Moving the boundary to avoid admitting failure |
Why Bitcoin support and resistance should be zones, not exact lines
An exact line suggests precision the market does not provide.
Bitcoin trades continuously across multiple venues. Different exchanges can print slightly different highs and lows. Fast moves, liquidations, thin weekend liquidity, and stop orders can produce long wicks. A cluster of candle bodies may show repeated acceptance around one price while the outer wicks cover a wider area.
Draw a zone in two stages:
- Use candle bodies and closes to mark the core, where price repeatedly spent time.
- Use nearby recurring wicks to mark the outer boundary, where rejection extended before price returned.
Do not include every extreme wick. One isolated spike is evidence of volatility, not automatically evidence of a durable level.
Zone width should also match the timeframe. A weekly Bitcoin zone can be much wider than a one-hour zone because the price range inside each candle is larger. Copying an arbitrary fixed percentage onto every chart creates false consistency.
The five-step workflow for finding Bitcoin support and resistance
Use this process on a clean candlestick chart before adding indicators.
Step 1: Choose the decision horizon
Your chart timeframe should match how long the decision is expected to remain relevant.
| Decision horizon | Start with | Refine with |
|---|---|---|
| Several weeks or months | Weekly | Daily |
| Several days or weeks | Daily | Four-hour |
| Intraday | Four-hour or one-hour | Lower timeframe only after the map is set |
The higher timeframe provides the map. The lower timeframe provides execution detail.
If your thesis is based on a daily support zone, a five-minute candle should not normally decide whether the thesis failed. Define confirmation and invalidation with daily evidence unless your written plan explicitly says otherwise.
Step 2: Mark obvious swing points
A swing high is a visible peak with lower highs on both sides. A swing low is a visible trough with higher lows on both sides.
Start with the turns you can see without zooming in. Prioritize:
- major weekly or daily turning points;
- the origin of a strong directional move;
- the top and bottom of a long consolidation;
- repeated closes or reversals in the same area;
- prior all-time or cycle highs and lows when they remain structurally relevant.
If the chart becomes crowded, you are marking observations rather than making decisions. Remove minor levels until only the areas that could change your plan remain.
Step 3: Combine nearby reactions into zones
Several nearby highs can form one resistance zone. Several nearby lows can form one support zone.
Use the cluster rather than drawing a separate line through every wick. A useful zone should explain multiple reactions without becoming so wide that almost any price action fits inside it.
Ask three questions:
- Where did candle bodies repeatedly stop or close?
- Where did recurring wicks show rejection?
- Is one extreme wick distorting the zone?
If one wick is far outside the rest, record it as an outlier instead of stretching the entire zone to include it.
Step 4: Rank the zones before price reaches them
Do not wait until Bitcoin touches a level to decide whether it matters. Score the zone in advance with the 12-point system below.
This reduces hindsight bias. It also stops you from promoting a weak level merely because price is currently near it.
Step 5: Write both the hold and failure scenarios
Every zone needs two plans:
Hold scenario
- What reaction would show buyers or sellers defending the area?
- Must price close back inside the zone?
- Is a lower-timeframe reversal enough, or is a higher-timeframe close required?
- Where would the first opposing zone become relevant?
Failure scenario
- What candle close would show acceptance through the zone?
- Must price retest the zone from the other side?
- What evidence would show a false breakout instead?
- Where does the original thesis become invalid?
If you cannot write both scenarios, the zone is not yet a decision framework. It is only a drawing.
The BTCMind 12-point zone quality score
Score six dimensions from 0 to 2. The total does not predict whether a zone will hold. It measures whether the area deserves attention and whether the evidence is clear enough to plan around.
| Dimension | 0 points | 1 point | 2 points |
|---|---|---|---|
| Timeframe | Visible only on a low timeframe | Clear on one useful timeframe | Clear on weekly/daily and still visible when refined |
| Reaction quality | Small, noisy response | One clean rejection or reversal | Multiple decisive departures or closes away |
| Independent tests | No meaningful retest | One later test | Multiple separated tests across time |
| Structure | In the middle of noise | Near a minor swing or range edge | Major swing, range boundary, or move origin |
| Confluence | No independent context | One additional factor | Two or more independent factors |
| Plan clarity | No confirmation or invalidation | One boundary is defined | Hold, failure, confirmation, and invalidation are written |
Interpret the result conservatively:
| Score | Classification | Beginner action |
|---|---|---|
| 0–4 | Weak observation | Remove it or keep it off the main chart |
| 5–7 | Secondary zone | Monitor, but require strong confirmation |
| 8–10 | Actionable research zone | Prepare both scenarios and alerts |
| 11–12 | Major decision zone | Prioritize it, but do not assume it will hold |
Avoid double-counting confluence
Confluence is useful only when the evidence is genuinely independent.
For example, a prior daily low, a horizontal support line drawn through that same low, and an indicator derived from the same price data are not three fully independent facts. They may be three descriptions of one price event.
Stronger confluence can combine different information types, such as:
- higher-timeframe horizontal structure;
- a clear range boundary;
- a rising trendline with multiple separated touches;
- an important moving average used by market participants;
- a high-volume reaction area;
- derivatives or sentiment evidence that is not derived from the same line on the chart.
The goal is not to collect the most labels. It is to avoid relying on one fragile observation.
Worked example: scoring a hypothetical Bitcoin support zone
Assume Bitcoin previously formed a daily swing low around a broad price area, rallied strongly, and returned to that area several weeks later. This is a hypothetical example, not a live level.
| Dimension | Observation | Score |
|---|---|---|
| Timeframe | Clear on daily, visible on weekly | 2 |
| Reaction quality | One strong rally began from the zone | 1 |
| Independent tests | One later retest held | 1 |
| Structure | Bottom of a multiweek range | 2 |
| Confluence | Range floor plus rising daily trend structure | 1 |
| Plan clarity | Daily reclaim, failure close, and invalidation written | 2 |
| Total | Actionable research zone | 9/12 |
The score does not mean the zone has a 75% probability of holding. Nine out of 12 is a quality classification, not a win rate.
A decision card could read:
Zone: Daily support area
Why it matters: Prior swing low + range floor
Hold evidence: Price enters the zone, rejects the lower boundary,
and closes the day back above the zone core
Failure evidence: Daily close below the outer boundary
Possible false-break evidence: Close below, then rapid reclaim and hold
Invalidation: Two daily closes below the zone or one decisive close
plus a failed retest from underneath
Next opposing area: Prior daily range midpoint or resistance zone
Maximum planned account risk: Defined before entry
This is more useful than “buy support” because it states what must happen, what would prove the idea wrong, and what risk is acceptable.
Candle closes, wicks, and acceptance
A wick through support or resistance shows that price traded beyond the boundary. It does not, by itself, prove that the market accepted the new area.
Use three separate questions:
- Did price trade through the zone? A wick can answer yes.
- Did price close through the zone? The relevant candle close provides stronger evidence.
- Did price remain or build structure beyond the zone? Follow-through or a retest helps judge acceptance.
For a daily zone, a daily close normally matters more than a brief intraday spike. A breakout can become stronger when price closes above resistance, later retests it, and continues to hold above it.
But waiting for confirmation creates a trade-off: it can reduce false signals while producing a later, less favorable entry. That is not a flaw. It is the cost of demanding more evidence.
False breakouts and failed breakdowns
A false breakout occurs when price moves above resistance but cannot stay there. A failed breakdown occurs when price moves below support but quickly reclaims it.
Warning signs include:
- a wick through the zone followed by a close back inside;
- a close beyond the boundary with no follow-through;
- a retest that immediately returns to the old range;
- a breakout candle with unusually poor liquidity or no volume expansion;
- a move driven by one sharp liquidation event rather than sustained trading;
- repeated movement through both sides of the same zone.
The final item matters most. If price repeatedly crosses a zone in both directions, the area may be losing decision value. Remove or downgrade it instead of continually widening it.
Support and resistance role reversal
After a breakout, old resistance may become support. After a breakdown, old support may become resistance. This is often called a role reversal or polarity change.
Treat it as a hypothesis, not a rule.
A stronger role reversal sequence is:
- price closes through the zone;
- price spends time on the new side;
- price returns to the zone;
- the retest is rejected;
- price continues away from the zone.
A weaker sequence is a single wick through resistance followed immediately by a return below it. That is an attempted breakout, not confirmed role reversal.
Horizontal zones, trendlines, and moving averages
These tools can all describe support and resistance, but they do not deserve equal weight in every situation.
Horizontal zones
Horizontal zones are usually the clearest place for beginners to start. They are tied to visible prior transactions and reactions rather than a continuously changing formula.
Use them for:
- prior swing highs and lows;
- range boundaries;
- repeated rejection clusters;
- former breakout or breakdown areas.
Trendlines and channels
A trendline connects rising lows in an uptrend or falling highs in a downtrend. A channel adds a parallel boundary.
Trendlines are sensitive to anchor selection. Small changes to the chosen wick or candle body can move the line. Prefer obvious, separated touches and avoid forcing the line through price merely to preserve a narrative.
Moving averages
A moving average can behave like dynamic support or resistance because many traders monitor it. It is still derived from past price, so it should confirm structure rather than replace it.
If a moving average crosses a horizontal zone, do not automatically count that as two strong independent signals. Ask whether the horizontal structure would matter without the indicator.
Add volume without turning it into a vote counter
Volume can help evaluate participation around a zone.
Useful observations include:
- a breakout accompanied by rising volume;
- repeated high-volume rejection from the same area;
- declining volume as price approaches resistance;
- heavy volume with little progress, suggesting absorption;
- a breakout on thin volume followed by a rapid return.
Volume does not make a breakout valid by itself. Crypto volume also differs across exchanges, so use a consistent and liquid data source. Compare the event with that venue's own recent history rather than treating one exchange's number as the entire market.
Turn a zone into a risk plan
The quality of a chart level does not determine how much capital you should risk.
Start with the maximum account loss you are willing to accept if the setup fails:
Maximum loss = account value × risk percentage
Then estimate position size from the distance between entry and invalidation:
Position size = maximum loss ÷ invalidation distance percentage
Hypothetical example:
- Account value: $10,000
- Maximum risk: 0.5% of the account
- Maximum planned loss: $50
- Distance from entry to invalidation: 2.5%
$50 ÷ 0.025 = $2,000 notional position size
This simplified calculation excludes fees, spread, slippage, funding, taxes, and gap-like execution during fast markets. Reduce size when those costs can be meaningful. A stop order also cannot guarantee the exact exit price.
If you use leverage, calculate liquidation risk separately. A technically sensible invalidation level is useless if the position can be liquidated before price reaches it.
Nine beginner mistakes that make zones less useful
1. Drawing too many levels
Keep only the zones that could change your decision. A chart filled with lines creates explanations after the fact rather than plans before the fact.
2. Treating the middle of a range like an edge
Support and resistance are usually more useful at clear range boundaries. The middle often has worse asymmetry and more two-way noise.
3. Mixing timeframes without rules
Do not build a daily thesis and invalidate it with a five-minute wick. Match the evidence to the decision horizon.
4. Moving a zone after every candle
Set the zone before the test. Update it only when new structure materially changes the map, not because the original idea is uncomfortable.
5. Assuming more touches always make a zone stronger
Repeated defenses can validate an area, but each test may also consume available orders. Evaluate the quality of the reactions, time between tests, and departure strength.
6. Buying support or shorting resistance automatically
A zone is where you look for evidence. It is not an automatic order instruction.
7. Confusing a quality score with probability
A 10/12 zone is not a promise of a particular win rate. The score organizes evidence; it does not produce calibrated odds.
8. Ignoring execution costs
Fees, spread, slippage, and funding can turn a narrow theoretical edge into a negative result.
9. Using support and resistance alone
Price structure is one layer. Market regime, momentum, volatility, derivatives positioning, liquidity, and event risk can change how a zone behaves.
For broader context, pair this guide with BTCMind's five-layer Bitcoin market cycle dashboard and four-layer crypto sentiment check. If an AI tool supplies levels or signals, apply the 15-check AI crypto trading signals trust audit before risking capital.
The 10-minute Bitcoin zone-mapping routine
Use this routine once per day or week, depending on your horizon.
- Open the higher-timeframe chart. Remove unnecessary indicators.
- Mark no more than three nearby zones. One below price, one above price, and one major distant area if relevant.
- Score each zone out of 12. Delete weak observations.
- Check the lower timeframe. Refine boundaries without changing the higher-timeframe thesis.
- Write the hold scenario. Specify the close, rejection, or reclaim you need.
- Write the failure scenario. Specify the close, retest, or acceptance that invalidates the idea.
- Set alerts at zone boundaries. Avoid staring at every candle.
- Calculate maximum loss and position size. Include an allowance for costs.
- Record the result. Note whether the zone held, failed, or became noisy.
After 20–30 observations, review which score dimensions were useful. Do not judge the method only by profit. Also measure whether your zones were drawn consistently, whether invalidations were respected, and whether you avoided impulsive entries.
Beginner worksheet
Copy this before marking a new Bitcoin support or resistance zone:
Asset and venue:
Decision horizon:
Mapping timeframe:
Execution timeframe:

Zone type: Support / Resistance
Zone core:
Outer boundary:
Why it exists:

Timeframe score (0–2):
Reaction score (0–2):
Independent-test score (0–2):
Structure score (0–2):
Confluence score (0–2):
Plan-clarity score (0–2):
Total (0–12):

Hold evidence:
Failure evidence:
False-break evidence:
Invalidation:
Next opposing zone:

Maximum account risk:
Estimated fees/slippage:
Position size:

What actually happened:
What I would change next time:
FAQ
Are Bitcoin support and resistance exact prices?
Usually not. Treat them as zones built from clusters of closes, candle bodies, and recurring wicks. Exact lines can create false precision.
How many touches make a support or resistance zone valid?
There is no universal number. One major higher-timeframe reversal can matter more than several small intraday touches. Evaluate timeframe, reaction quality, structure, and separation between tests.
Which timeframe is best for Bitcoin support and resistance?
Use the timeframe that matches your decision horizon. Weekly and daily charts are useful for longer-term structure; four-hour and one-hour charts can refine shorter-term decisions. Start higher, then move lower.
Does broken resistance always become support?
No. Role reversal is a hypothesis. Look for a close through the zone, acceptance on the new side, a retest, and renewed movement away.
Should beginners use indicators with support and resistance?
Beginners can start with horizontal structure and clean price action. Add indicators only when each has a defined purpose and does not duplicate the same evidence.
Is a wick below support a breakdown?
It shows price traded below support, but it may not show acceptance. Compare the wick, candle close, follow-through, and any retest using the timeframe that controls the thesis.
Can AI identify Bitcoin support and resistance?
AI can help scan swing points, repeated reactions, volume, and multi-timeframe structure. Its output still requires timeframe definitions, source data, invalidation rules, and human review. Treat any AI-generated level as a research hypothesis rather than a guaranteed signal.
Final takeaway
Bitcoin support and resistance become useful when they change your process, not when they decorate your chart.
Start with higher-timeframe structure. Draw zones instead of perfect lines. Score the evidence before price arrives. Write both the hold and failure scenarios. Define invalidation and maximum loss before entry. Then record what happened so the method can improve.
The goal is not to predict every turn. It is to know where attention should increase, what evidence would justify action, and what would prove the idea wrong.
BTCMind uses six specialized AI agents to examine technical structure, derivatives, bull and bear cases, and tail risk before producing a research brief. Explore the BTCMind research workflow or get the app to compare a multi-agent brief with your own zone map.