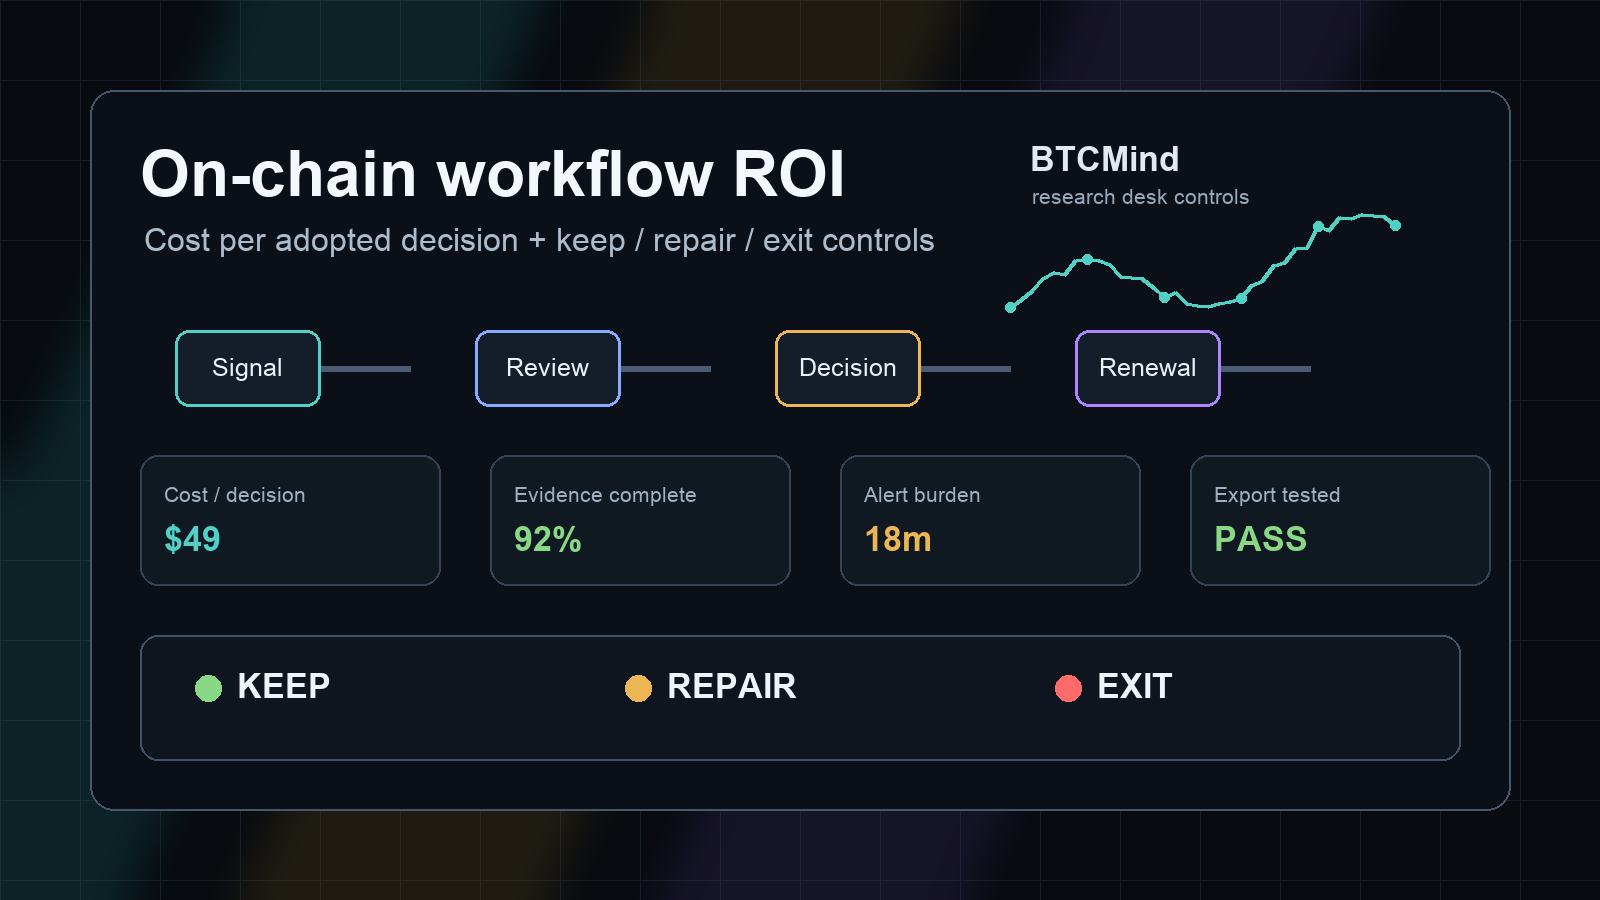
On-Chain Signal Workflows: Cost and ROI Guide
Updated August 11, 2026. On-chain analytics can cost nothing, hundreds of dollars per month, or a custom institutional budget. The real buying question is not, “Which dashboard has the most metrics?” It is, “Which workflow produces enough usable decisions to justify its full cost?”
That full cost includes subscriptions, API credits, analyst time, data cleaning, alert review, maintenance, false positives, and switching risk. A free dashboard that consumes six hours a week may cost more than a paid workflow that produces one auditable decision card in 20 minutes.
This on-chain signal workflows: cost and ROI guide gives you a four-tier comparison, a spreadsheet-ready ROI model, a vendor-quote normalization checklist, a decision-utilization ledger, a 12-month budget envelope, a confidence-adjusted ROI model, a 90-day pilot plan, build-versus-buy thresholds, a renewal control sheet, a 30-day instrumentation pack, an eight-metric ROI operating dashboard, a signal go/no-go map, an approval packet for paid plans, a kill-switch and downgrade matrix, three sensitivity tests, and a 24-point adoption scorecard. It deliberately measures process value, not hypothetical trading profit.
The short answer: buy the smallest workflow that changes a decision
Most individuals should start with a free manual workflow, prove that a small metric set repeatedly changes a defined decision, and only then pay for saved time, deeper history, alerts, collaboration, or automation.
Use this sequence:
- Define the decision before selecting the data.
- Measure the current workflow's cash and labor cost for 30 days.
- Test one higher-cost tier against the same decision contract.
- Count only decisions the workflow changed or clarified.
- Reject the upgrade if it does not beat the baseline after full costs.
The target is not more alerts. It is fewer, faster, better-documented decisions.
That is the standard this on-chain signal workflows: cost and ROI guide uses throughout the rest of the worksheet.
What an on-chain signal workflow actually includes
An on-chain workflow is more than a chart subscription. It is the complete path from a market question to an auditable action or explicit no-action:
Question → metric definition → source → collection → validation
         → context → contradiction check → decision → review
A usable workflow should answer:
- What decision can this signal change?
- Which entity labels, addresses, assets, and time windows does it cover?
- How often does it update, and what is the expected lag?
- Can the observation be reproduced later?
- Which market, derivatives, liquidity, or event evidence can contradict it?
- What invalidates the interpretation?
- Who owns the alert, review, and final decision?
For exchange-flow metrics, attribution matters as much as the headline number. Wallet relabeling, internal transfers, venue concentration, and asset composition can distort a reserve or inflow chart. Use the four-layer on-chain exchange reserves framework before treating a balance change as an independent market signal.
The full on-chain analytics cost equation
Use total cost of ownership, not the advertised subscription price:
Monthly workflow cost
= subscription and usage fees
+ analyst research time
+ setup and recurring maintenance
+ false-alert review time
+ expected error cost
+ switching and coordination cost
- reusable output value
1. Subscription and usage fees
Vendor plans are not directly comparable. One plan may sell charts and alerts; another may meter API credits, history, data resolution, seats, or licensing.
Current official plan context checked on August 11, 2026:
- CryptoQuant's pricing page lists Basic as free, Advanced at $39 per month billed monthly or $29 per month billed yearly, Professional at $109 per month billed monthly or $99 per month billed yearly, and Premium at $799 per month billed yearly with annual billing only. It also separates chart resolution, history, alerts, CSV, API access, API limits, seats, and license terms by tier.
- Dune's current credit docs describe a usage-based credit system where query execution consumes credits in proportion to actual compute use. The same docs list Free, Analyst, Analyst Annual, Plus, Plus Annual, Legacy Premium, and Enterprise examples, with Free showing 2,500 credits per month, Analyst at $75 monthly or $65 per month billed annually, and Plus at $399 monthly or $349 per month billed annually. Treat Dune as a plan-plus-usage workflow: model query frequency, refresh cadence, API calls, extra-credit limits, storage, data writes, and failed-query behavior instead of comparing only the subscription label.
- Nansen's Pro plan article says Nansen Pro is $49 per month on annual billing or $69 per month on monthly billing, with web and mobile access, supported-chain analytics, smart alerts, portfolios, AI Agent prompts, and API/MCP one-time credits. Verify chain coverage and any credit limits inside the current buying flow before relying on it for production monitoring.
- Glassnode Studio pricing distinguishes Advanced, Professional, and Vector. The public page states that API access is not included in Advanced, can be selected as an optional Professional add-on, and that Data Credits are consumed by downloads, API calls, CLI, and similar exports; its FAQ also notes that API calls cost 1 credit for Bitcoin and 2 credits for any altcoin. Glassnode Vector is listed separately as starting at $749 per month. Confirm the final configured Professional quote, credits, seats, commercial rights, and export needs before approval.
Prices and plan structures change. Save the date, billing period, taxes, currency, included credits, overage rules, seats, and cancellation terms in your worksheet.
Normalize vendor quotes before comparing plans
A monthly-equivalent price can hide the largest differences between two workflows. Convert every quote into the same operating unit before you compare it.
| Quote field | What to record | Why it changes ROI |
|---|---|---|
| Cash commitment | Monthly equivalent and cash due at purchase | An annual plan can pass a monthly break-even test but still fail a cash-budget test |
| Included usage | API credits, query units, refreshes, exports, alerts | A low base price can become expensive when the real workflow exceeds included usage |
| Overage rule | Unit price, hard cap, throttling, or forced upgrade | Unbounded overages make cost per decision unstable |
| Data history | Earliest date and resolution by tier | Backtests and cycle comparisons may require a higher tier than daily monitoring |
| Coverage | Assets, chains, entities, venues, and metric families | Missing coverage creates duplicate subscriptions or manual work |
| Freshness | Update interval and expected processing lag | A faster plan has no value if the decision is weekly |
| Seats and sharing | Included users, workspaces, dashboards, exports | Collaboration cost often appears after the pilot succeeds |
| Commercial rights | Internal use, client use, publication, redistribution | A research team and a content publisher may need different licenses |
| Support | Documentation, response target, onboarding, account support | Poor support increases analyst and engineering time during incidents |
| Exit terms | Renewal date, cancellation window, export access | Switching cost rises when evidence and decision history cannot leave the platform |
Calculate an effective monthly cost:
Effective monthly cash cost
= base plan monthly equivalent
+ expected usage overages
+ required seats and add-ons
+ taxes and currency costs
+ one-time setup cost ÷ expected months of use
Do not compare a free dashboard with a paid API by price alone. Compare the smallest complete configurations that can execute the same decision contract.
2. Analyst time
Measure the complete research loop:
- opening and normalizing dashboards;
- checking metric definitions and label changes;
- comparing time windows and assets;
- verifying the observation with market and derivatives data;
- documenting the decision and invalidation;
- reviewing whether the signal helped.
Convert time into cost:
Monthly labor cost = hours per month × value per decision hour
Use the value of time that can actually be redeployed. If a hobbyist values the process itself, the appropriate hourly value may be low. If a professional can replace repetitive collection with paid analysis, the value may be materially higher.
3. Setup and maintenance
Include initial and recurring work:
- wallet lists and entity labels;
- saved queries and chart templates;
- alert thresholds and routing;
- data cleaning and joins;
- spreadsheet, notebook, or database upkeep;
- API keys, rate limits, retries, and monitoring;
- documentation and reviewer training.
Amortize one-time setup across a realistic evaluation period:
Monthly setup allocation = one-time setup cost ÷ expected months of use
Do not amortize across three years when you have not yet completed a 90-day pilot.
4. Unused capacity and ignored alerts
More metrics can lower ROI when they create review debt. Track:
Metric utilization = metrics used in documented decisions
                     ÷ metrics saved or monitored

Alert utilization = alerts that triggered a completed review
                    ÷ total alerts delivered
Low utilization during discovery is normal. Low utilization after a structured trial means the plan is oversized, thresholds are noisy, or the monitored questions have no owner.
5. Expected error cost
On-chain data is interpreted data. Entity labels can change, metrics can be revised, and multiple indicators may derive from the same underlying flow.
Estimate error cost conservatively:
Expected monthly error cost
= error probability × decision impact × exposure factor
The exposure factor prevents a research worksheet from pretending every error causes the full portfolio loss. Define it before the trial and use the same convention for baseline and candidate workflows.
6. Switching and exit cost
A workflow has switching risk when saved queries, labels, alert rules, annotations, decision logs, or transformed data cannot be exported in a usable form.
Record:
- which artifacts can be exported;
- whether exports preserve timestamps and definitions;
- whether proprietary identifiers must be remapped;
- how long it would take to rebuild the workflow elsewhere;
- whether annual billing traps an unproven workflow.
Treat the estimated exit effort as part of the purchase decision, not a future problem.
Four on-chain signal workflow tiers
| Tier | Typical setup | Best fit | Main cost risk | Upgrade trigger |
|---|---|---|---|---|
| 1. Free manual | Public explorers, free dashboards, spreadsheet | Occasional decisions and a small metric set | High labor, inconsistent notes | Repetitive collection exceeds break-even time |
| 2. Paid dashboard | One provider with history, alerts, exports | Active individual analyst | Paying for unused metrics or noisy alerts | A second evidence family is repeatedly required |
| 3. Multi-source desk | On-chain plus spot, derivatives, liquidity, news | High-conviction or published research | Tool sprawl and duplicate evidence | Repeatable manual joins become the bottleneck |
| 4. API and automation | APIs, transforms, storage, monitoring, review UI | Continuous or portfolio-wide monitoring | Engineering and data-governance overhead | Manual workflow is proven and latency matters |
Tier 1: free manual workflow
Start with three to five metrics tied to one decision. A practical Bitcoin example might include exchange netflow, realized profit/loss behavior, long-term-holder activity, and one network-demand measure. Record the observation, source timestamp, interpretation, contradiction, and action.
Tier 1 is inexpensive in cash but expensive in discipline. It fails when tabs multiply, definitions drift, or the analyst remembers only the signals that matched the outcome.
Tier 2: paid dashboard workflow
Pay for capabilities that remove a measured bottleneck: longer history, better resolution, saved layouts, exports, alerts, or more reliable entity coverage.
Do not upgrade because the premium tier displays more indicators. Upgrade because the baseline shows a recurring task the paid tier can remove or a required control the free tier cannot provide.
Tier 3: multi-source research desk
Add another provider only when it contributes a different evidence family or resolves a known coverage problem. A sound desk may combine:
- on-chain activity and entity flows;
- spot price structure and volume;
- derivatives positioning and liquidations;
- liquidity and stablecoin conditions;
- event and tail-risk monitoring.
Prevent correlated evidence from becoming fake confirmation. Exchange balance, netflow, and exchange inflow may be different views of the same underlying movement. Give each evidence family one vote.
Connect the on-chain layer to a five-layer Bitcoin market intelligence workflow rather than allowing wallet flows to dominate the conclusion.
Tier 4: API and automated workflow
Automation can reduce collection time, but it adds engineering cost, failure modes, and monitoring responsibilities. A production workflow needs schema checks, rate-limit handling, missing-data rules, retries, versioned definitions, alert ownership, and human review.
Automate only after the manual process has demonstrated repeatable value. Otherwise you create a faster pipeline for a metric nobody should use.
Before acting on generated outputs, apply an AI crypto trading signals trust audit to data lineage, confidence, backtests, permissions, and rejection rules.
The ROI model: measure process value, not trading profit
Avoid claiming that an analytics subscription “made” the portfolio return. Markets move for many reasons, and a short period cannot isolate the tool's causal contribution.
Use this operational model instead:
Monthly process value
= useful hours saved × value per decision hour
+ avoided duplicated work
+ value of reusable research outputs
+ expected error reduction

Monthly process ROI
= (monthly process value - full monthly workflow cost)
   ÷ full monthly workflow cost
A positive number is not automatically a buy. The benefits should be repeatable, documented, and robust to conservative assumptions.
Add a decision-utilization ledger
ROI models fail when teams count every alert, dashboard view, or exported chart as value. Track utilization at the decision level instead.
For each research cycle, log one row:
| Field | Example entry |
|---|---|
| Decision ID | BTC-RISK-2026-08-03-01 |
| Question | Should portfolio risk remain unchanged this week? |
| On-chain observation | Exchange inflow anomaly exceeded the pre-set review threshold |
| Contradicting evidence | Spot absorption remained firm; funding was neutral |
| Workflow effect | Clarified; no position change, monitoring threshold tightened |
| Decision minutes saved | 28 |
| Avoided duplicate work | Two analysts did not repeat the same check |
| Confidence | Medium |
| Evidence link | Saved chart, query, or source snapshot |
| Review result | Useful, neutral, misleading, or not reviewable |
Summarize the ledger monthly:
Decision utilization rate
= changed or clarified decisions ÷ completed research cycles

Evidence completeness rate
= decisions with reproducible source evidence ÷ logged decisions

Cost per adopted decision
= total monthly workflow cost ÷ changed or clarified decisions retained after review
An explicit no-action can count as a clarified decision when the workflow resolves uncertainty against a predefined decision contract. A generic “market looks risky” alert does not count.
Use the review result to apply a quality adjustment:
Quality-adjusted adopted decisions
= useful decisions
+ (neutral decisions × 0.25)
- misleading decisions
This adjustment prevents a high-volume alert system from looking efficient when it creates rework or false confidence.
Cost per usable decision
Define a usable decision as a documented action or explicit no-action that the workflow changed or clarified.
Cost per usable decision
= full monthly workflow cost ÷ usable decisions
Do not count charts viewed, alerts opened, notes written, or trades placed without a documented change in reasoning.
Break-even time saved
Break-even hours saved
= incremental monthly cash cost ÷ value per decision hour
A $99 monthly plan requires 1.98 useful hours saved at a $50 hourly value before non-time benefits count. If the annual commitment is $1,188, run the calculation on both monthly-equivalent and cash-commitment bases.
Risk-adjusted workflow value
Not every claimed benefit should receive full credit. Apply confidence weights:
Risk-adjusted process value
= Σ (benefit estimate × evidence confidence)
Example confidence levels:
- 100%: measured time saved across repeated tasks.
- 75%: avoided work supported by a clear baseline.
- 50%: likely error reduction with documented controls.
- 25%: qualitative benefit not yet repeated.
- 0%: hypothetical trading profit or an unverifiable claim.
Spreadsheet-ready ROI worksheet
Create one row per month and use the same definitions for the baseline and candidate workflow.
| Input | Baseline | Candidate | How to measure |
|---|---|---|---|
| Subscription and API spend | Invoice plus expected credits and overages | ||
| Research hours | Timer or calendar, not memory | ||
| Hourly decision value | Redeployable value, held constant | ||
| Setup allocation | Setup hours and cash divided by pilot months | ||
| Maintenance hours | Query, alert, label, and integration upkeep | ||
| Alerts delivered | System count | ||
| Alerts fully reviewed | Completed review record | ||
| Usable decisions | Changed or clarified action/no-action | ||
| Reusable outputs | Briefs, dashboards, or datasets used again | ||
| Estimated error cost | Predefined probability-impact convention | ||
| Exit and switching hours | Rebuild and export estimate |
Then calculate:
Cash cost = subscription + API + other paid services

Labor cost = (research hours + maintenance hours)
             × hourly decision value

Full cost = cash cost + labor cost + setup allocation
            + expected error cost + switching allocation

Useful time value = max(0, baseline research hours - candidate research hours)
                    × hourly decision value

Risk-adjusted value = useful time value
                      + weighted reusable output value
                      + weighted error reduction

Process ROI = (risk-adjusted value - candidate full cost)
              ÷ candidate full cost
For an upgrade comparison, also calculate incremental ROI using only the costs and benefits above the baseline. This prevents the candidate from receiving credit for decisions the free workflow already produced.
Add a 30-day instrumentation pack before calculating ROI
The spreadsheet model is only useful if the workflow emits comparable evidence. Before the pilot starts, define the event log, source-health log, alert ledger, and decision card template. Without those instruments, the team will argue about memory, not measurement.
Use four lightweight logs:
| Log | Minimum fields | Owner | ROI input produced |
|---|---|---|---|
| Source-health log | Source, expected check time, actual check time, success/fail, lag, fallback used | Workflow owner | Source availability, downtime cost, fallback labor |
| Alert ledger | Alert ID, threshold, source, created time, reviewed time, disposition, review minutes | Analyst | False-positive burden, alert precision proxy |
| Decision card | Question, evidence links, contradiction check, action/no-action, owner, invalidation | Decision owner | Adopted decisions, evidence completeness |
| Cost ledger | Subscription, credits, seats, setup hours, maintenance hours, export cost | Budget owner | Fully loaded cost, cost per adopted decision |
Keep the instrumentation boring. A shared sheet is acceptable for an individual researcher. A team can use a database or ticket queue, but the fields should stay stable for the first 30 days. Changing the measurement system during the pilot makes the before-and-after comparison weaker.
Event schema for on-chain signal workflows
At minimum, every alert or manual observation should produce one event:
{
  "event_id": "oc-2026-08-08-001",
  "source": "provider_or_query_name",
  "metric": "exchange_netflow_btc",
  "asset": "BTC",
  "observed_at": "2026-08-08T09:00:00Z",
  "source_updated_at": "2026-08-08T08:52:00Z",
  "threshold": "netflow_zscore_gt_2",
  "review_owner": "analyst",
  "review_minutes": 12,
  "decision_id": "BTC-RISK-2026-08-08-01",
  "disposition": "clarified_no_action",
  "evidence_url": "saved_chart_or_query_snapshot"
}
The schema does not need to be perfect. It needs to be consistent enough that a monthly review can answer three questions without rework:
- Which signals reached a real decision?
- Which signals consumed time and produced no usable decision?
- Which source or integration failed when the decision window was open?
Minimum sample before annual commitment
Do not buy an annual plan from a two-day impression. Require a minimum sample before the renewal memo recommends annual billing:
| Sample requirement | Minimum before annual approval | Why it matters |
|---|---|---|
| Completed research cycles | 8 | Captures quiet and active periods |
| Adopted or clarified decisions | 5 | Prevents paying for unused dashboards |
| Source-health checks | 30 | Exposes update lag and missed checks |
| Reviewed alerts | 50 or all alerts, whichever is lower | Measures false-positive burden |
| Export test | 1 full export and restore | Proves evidence can leave the tool |
| Fallback drill | 1 primary-source removal test | Tests concentration risk |
If the workflow cannot produce this sample in 30 to 90 days, the decision itself may not be frequent enough to justify a large subscription. Keep the plan monthly, narrow the monitored questions, or use a free/manual tier until the decision volume is real.
Attribution rule for mixed research desks
On-chain analytics rarely acts alone. A decision may also depend on spot structure, derivatives, news, liquidity, and portfolio risk limits. Attribute value only to the evidence family that changed the decision.
Use this split:
| Workflow effect | On-chain value credit |
|---|---|
| On-chain evidence changed the action or explicit no-action | 100% of the qualified decision value |
| On-chain evidence clarified timing but did not decide direction | 50% |
| On-chain evidence confirmed a decision already made by other evidence | 25% |
| On-chain evidence was reviewed but unused | 0% |
| On-chain evidence was misleading and caused rework | Negative cost only |
This keeps the ROI model honest. It also matches how BTCMind structures research: on-chain evidence should be challenged by technical, derivatives, tail-risk, and contradictory bull/bear arguments before it becomes a final brief.
The instrumentation pass/fail gate
Before a workflow graduates from pilot to renewal, require these controls:
- Pass: at least 90% of adopted decisions have reproducible evidence links.
- Pass: the largest provider has survived one removal test or has a documented fallback.
- Pass: alert review burden is below the time savings claimed in the ROI model.
- Pass: cost per adopted decision is below the ceiling approved before the pilot.
- Fail: the renewal case depends on hypothetical trading returns.
- Fail: the tool cannot export the decision history, saved queries, or source snapshots needed for audit.
- Fail: the same false-positive class appears in two monthly reviews without a threshold change.
This gate is deliberately operational. A workflow can have excellent charts and still fail if it cannot prove that it changes decisions at an acceptable cost.
Build a 12-month budget envelope before comparing plans
A monthly subscription comparison is too narrow for a business evaluation. It can hide annual prepayment, onboarding labor, credit overages, implementation work, and the cost of carrying a workflow that is useful only during volatile months. Build a 12-month budget envelope before approving a vendor or internal build.
Use five budget buckets:
- Committed cash: subscriptions, annual prepayment, minimum API spend, required seats, and non-refundable onboarding fees.
- Variable cash: query credits, overages, extra data feeds, storage, model usage, and contractor support.
- Implementation labor: setup, query migration, alert design, identity labels, testing, documentation, and user training.
- Operating labor: recurring review, maintenance, reconciliation, exception handling, and monthly ROI reporting.
- Exit reserve: exports, replacement queries, archived evidence, contract overlap, and retraining if the workflow is rejected or the vendor changes terms.
Calculate three views instead of one:
Annual cash commitment = prepaid subscription + minimum usage
                         + required add-ons + expected variable spend

Annual fully loaded cost = annual cash commitment
                           + implementation labor
                           + operating labor
                           + expected error cost

Annual reversible cost = annual fully loaded cost
                         - refundable cash
                         - reusable implementation assets
                         - portable data and query value
The third number matters because two workflows with the same first-year cost can create very different lock-in. A query library built on portable SQL, documented metric definitions, and exportable decision records retains value after cancellation. A proprietary alert system with no history export may have almost no reversible value.
Use a low, base, and high utilization case
Forecasting one utilization number creates false precision. Model three cases:
| Case | Adopted decisions | Alert-review burden | Variable usage | Purpose |
|---|---|---|---|---|
| Low | 50% of base | 150% of base | 70% of base | Tests whether weak adoption destroys the business case |
| Base | Measured pilot rate | Measured pilot rate | Measured pilot rate | Represents the most defensible operating case |
| High | 125% of base | 110% of base | 140% of base | Tests capacity, overages, and marginal value |
Do not assume the high case produces proportionally more value. More alerts often increase review cost faster than they increase adopted decisions. The workflow should demonstrate that higher usage improves coverage or speed without collapsing evidence quality.
Separate budget approval from product-plan selection
Approve the workflow budget first, then select the plan that fits inside it. This reverses the common process of starting with a vendor tier and inventing a justification afterward.
A simple approval sequence is:
- Define the recurring decision and minimum evidence contract.
- Set the maximum acceptable annual fully loaded cost.
- Set minimum evidence completeness, source availability, and cycle-time targets.
- Run the 90-day pilot on the smallest viable plan.
- Select monthly, annual, API, or internal-build capacity only after measured utilization is available.
If the workflow cannot pass on monthly pricing, it usually should not be rescued by a discounted annual commitment. The discount reduces unit price, but it does not fix low adoption, noisy alerts, weak exports, or unreliable evidence.
Apply a confidence haircut to ROI claims
ROI inputs do not deserve equal trust. Invoice cost is known. Time saved may be measured. Avoided error cost is usually estimated. A reusable dashboard may have value, but only if another decision actually uses it. Apply a confidence haircut before presenting the business case.
Assign every benefit to one evidence grade:
| Grade | Evidence standard | Allowed value weight |
|---|---|---|
| A | Repeated direct measurement with timestamps and comparable tasks | 100% |
| B | Measured in a limited pilot with a documented baseline | 75% |
| C | Supported estimate with an owner, method, and review date | 50% |
| D | Qualitative benefit or one-off observation | 25% |
| F | Hypothetical trading profit, retrospective story, or unverifiable claim | 0% |
Then calculate:
Confidence-adjusted benefit = sum(each claimed benefit × allowed value weight)

Confidence-adjusted ROI = (confidence-adjusted benefit - full cost)
                          ÷ full cost
Suppose a candidate claims $900 of monthly value:
- $300 of repeated time savings is Grade A and keeps $300;
- $300 of pilot-only error reduction is Grade B and keeps $225;
- $200 of estimated reusable-output value is Grade C and keeps $100;
- $100 of hypothetical avoided trading loss is Grade F and keeps $0.
The confidence-adjusted benefit is $625, not $900. If full monthly cost is $500, reported ROI falls from 80% to 25%.
This haircut does not mean uncertain benefits are worthless. It prevents an annual commitment from depending on benefits that have not yet survived repeated use.
Add an ROI confidence score
Track the percentage of claimed benefit supported by Grade A or B evidence:
ROI confidence score = Grade A and B benefit before weighting
                       ÷ total claimed benefit before weighting
Use the score as a renewal control:
- 80%–100%: the business case is mostly measured;
- 60%–79%: renew only if stress cases remain positive;
- 40%–59%: keep monthly terms and close evidence gaps;
- below 40%: reject annual commitment or reduce scope.
The score should rise over time. If a workflow has been operating for six months and most of its value is still Grade C or D, the problem is not only measurement. The workflow may not be changing enough decisions to justify its place in the stack.
Use a procurement approval matrix
Finance, research, and engineering evaluate different risks. Put them in one approval matrix so a cheap plan cannot pass with poor evidence and a technically elegant build cannot pass with weak utilization.
| Gate | Required evidence | Owner | Reject when |
|---|---|---|---|
| Decision fit | Written decision contract and action/no-action output | Research owner | Metrics are interesting but not tied to a recurring decision |
| Data fit | Coverage, methodology, history, labels, and source checks | Research owner | Required evidence cannot be reproduced or challenged |
| Economic fit | Low, base, and high 12-month cases | Budget owner | Base case is negative or low case threatens the annual commitment |
| Operating fit | Alert burden, maintenance, failure handling, and handoff | Workflow owner | No one owns exceptions or monthly measurement |
| Technical fit | API limits, exports, access controls, and observability | Engineering owner | Failure is silent or critical artifacts cannot be exported |
| Exit fit | Cancellation date, export test, replacement estimate | Budget owner | Switching cost is unknown before signature |
Require every gate to pass. Do not average the matrix into a single vendor score that allows a strong interface to offset missing exports or allows low subscription cost to offset unowned maintenance.
For an individual researcher, one person may own all six gates. The structure still matters because it separates enthusiasm for a tool from the evidence required to keep paying for it.
Build an approval packet before you enter a card
The most useful on-chain signal workflows: cost and ROI guide is not the spreadsheet that proves a purchase after the decision is already made. It is the packet that forces the buyer to show what will change if the subscription, API, or annual renewal is approved.
Use this approval packet for any paid dashboard, multi-source desk, or API workflow:
| Packet field | Required evidence | Reject or defer when |
|---|---|---|
| Decision contract | One sentence naming the portfolio, research, risk, or monitoring decision | The workflow supports "better awareness" but no defined decision |
| Baseline cost | Current monthly cash cost, research hours, alert-review hours, and cycle time | Baseline is estimated from memory instead of logged for at least one cycle |
| Candidate cost | Monthly equivalent, cash due now, credits, seats, overages, add-ons, taxes, and cancellation window | The quote cannot be normalized against the baseline |
| Owner map | Workflow owner, budget owner, alert reviewer, fallback owner, and renewal reviewer | One person is expected to own every failure mode |
| Evidence packet | Three recent decision cards showing source links, contradiction checks, action/no-action, and review result | The signal changes conclusions but leaves no reproducible evidence |
| Control limits | Approved cost ceiling, alert ceiling, evidence-completeness floor, and source-failure response | Thresholds will be chosen after adoption rather than before |
| Exit plan | Exportable artifacts, rebuild time, renewal notice date, and lock-in risks | Saved queries, notes, or labels cannot leave the tool in usable form |
| Recommendation | Approve monthly, approve annual, defer, resize, renegotiate, replace, or reject | The recommendation is "buy" without a smaller-plan comparison |
This packet turns vendor selection into an operating decision. A dashboard that saves time but lacks exportable evidence may be acceptable for personal monitoring and unacceptable for published research. An API that looks expensive may be justified if it removes a measured decision bottleneck and has a named owner for retries, schema changes, and source downtime.
Score the approval packet before procurement
Give each field 0, 1, or 2 points:
| Score | Meaning |
|---|---|
| 0 | Missing, unverifiable, or based on a claim that cannot be checked |
| 1 | Present but incomplete, manually maintained, or not yet tested under stress |
| 2 | Complete, reproducible, owned, and already tested against the baseline |
Interpret the total:
| Total score | Decision |
|---|---|
| 0-7 | Reject or return to baseline measurement |
| 8-11 | Defer; run another measured cycle or narrow the scope |
| 12-14 | Approve monthly only, with a dated repair list |
| 15-16 | Approve monthly or annual if the stress tests also pass |
Do not average away a zero in control limits, evidence packet, or exit plan. Any of those zeros can make a positive ROI estimate operationally unsafe.
Convert the packet into a renewal calendar
Every approved workflow should leave behind a renewal calendar entry on day one. Include:
- renewal notice deadline;
- owner responsible for the memo;
- required monthly ledger exports;
- minimum decision-card sample;
- source-health and downtime evidence;
- expected credit or usage range;
- downgrade or cancellation path;
- next-tier trigger, if any.
The renewal calendar protects the buyer from discovering lock-in after the workflow has become familiar. It also keeps the on-chain analytics ROI discussion tied to observed behavior instead of the original sales promise.
Add a kill-switch layer to the on-chain signal workflows: cost and ROI guide
An ROI model is incomplete until it says when to stop paying. Many on-chain signal workflows fail quietly: the dashboard remains useful enough to open, but not useful enough to change decisions. The renewal memo should therefore include kill switches, downgrade triggers, and repair deadlines before the invoice renews.
Use three states:
| State | Meaning | Default action |
|---|---|---|
| Keep | The workflow still changes or clarifies decisions at an acceptable cost | Renew at the smallest tier that preserves the measured controls |
| Repair | The workflow has useful evidence but one control is failing | Keep monthly terms and assign one owner, one fix, and one deadline |
| Exit | The workflow no longer beats the baseline after full costs | Export evidence, cancel or downgrade, and return to the baseline workflow |
The state should come from measured controls, not preference for the interface. A beautiful dashboard with weak exports, unowned alerts, or low decision utilization is still an exit candidate.
Kill switches for paid dashboards and APIs
Set hard stops before renewal:
| Kill switch | Trigger | Why it matters |
|---|---|---|
| Decision adoption failure | Fewer than three changed or clarified decisions in the review period | The workflow is not attached to a recurring decision |
| Evidence failure | Evidence completeness falls below 80% for adopted decisions | The research cannot be audited or challenged later |
| Alert burden failure | Review minutes exceed time saved for two cycles | Automation is creating work instead of removing it |
| Source reliability failure | Critical source downtime or lag appears in two decision windows without a fallback | The workflow is not dependable when it matters |
| Cost ceiling failure | Cost per adopted decision exceeds the approved ceiling by 25% or more | The business case has drifted from the approval packet |
| Export failure | Saved queries, labels, decisions, or snapshots cannot be exported before renewal | The buyer is accepting lock-in without evidence portability |
One failed kill switch does not always mean immediate cancellation. It does mean the next payment should not be automatic. The renewal owner should either repair the failure with a dated test or move the workflow to a smaller plan.
Downgrade triggers before cancellation
Some workflows deserve resizing rather than rejection. Downgrade when the evidence is useful but the purchased capacity is too large.
| Symptom | Downgrade move | Control to retest |
|---|---|---|
| Most decisions use only a small metric set | Move from premium dashboard to lower tier or saved public views | Evidence completeness and cycle time |
| API credits are mostly unused | Reduce credit bundle or switch low-frequency checks to manual pulls | Cost per adopted decision |
| Alerts are noisy but manual charts are useful | Disable alerting and keep research access only | False-positive burden |
| Multi-source desk duplicates one evidence family | Remove the weaker duplicate provider | Contradiction quality and source concentration |
| Annual plan passes monthly ROI but fails cash-commitment stress | Stay monthly until another measured cycle improves confidence | Low-case 12-month budget |
This downgrade layer keeps the on-chain signal workflows: cost and ROI guide practical for small teams. The choice is rarely "enterprise stack or nothing." The better question is which smallest tier preserves the decision contract.
A one-page exit memo
When the workflow fails, write an exit memo instead of letting the subscription disappear without learning. Include:
- the original decision contract;
- the approved cost ceiling and actual cost per adopted decision;
- the three most useful evidence cards;
- the failed kill switch;
- exported artifacts and missing artifacts;
- what returns to the baseline workflow;
- what would justify a future retest.
Store the exit memo beside the approval packet. Future buyers should see whether the prior failure came from the vendor, the metric set, the decision frequency, weak ownership, or unrealistic ROI assumptions.
That learning loop is what makes an on-chain signal workflows: cost and ROI guide useful after the first purchase decision.
Three worked scenarios
The numbers below are examples, not vendor quotes or promised outcomes.
| Scenario | Monthly cash | Labor and upkeep | Full cost | Usable decisions | Cost per usable decision | Interpretation |
|---|---|---|---|---|---|---|
| Occasional holder, free manual | $0 | $120 | $120 | 2 | $60 | Acceptable if research is infrequent and consistent |
| Active analyst, paid dashboard | $99 | $300 | $399 | 8 | $49.88 | Upgrade works only if it beats the manual baseline on time or quality |
| Automated multi-source desk | $600 | $1,800 | $2,400 | 20 | $120 | Poor fit unless latency, coverage, or reusable outputs justify overhead |
Example: paid dashboard versus manual research
Assume the manual workflow costs $0 in cash and 8 hours per month. At $50 per useful hour, its monthly labor cost is $400.
The candidate dashboard costs $99 and reduces the same research loop to 4.5 hours. Labor becomes $225, so full monthly cost becomes $324.
Monthly cost reduction = $400 - $324 = $76
Incremental process ROI = $76 ÷ $99 = 76.8%
That result is promising only if the candidate preserves or improves data quality, contradiction checks, and decision documentation. If it produces 30 additional alerts that require three hours to dismiss, the upgrade loses its advantage.
A 90-day pilot that prevents premature annual contracts
Days 1–14: establish the baseline
Choose one recurring decision, such as whether exchange-flow conditions change a weekly risk posture. Lock:
- the metric definitions;
- required evidence families;
- review cadence;
- action and no-action outputs;
- invalidation rules;
- time-tracking method.
Run the current workflow without changing tools. Record cash cost, hours, alerts, usable decisions, errors, and reusable outputs.
Days 15–30: configure one candidate
Test one tier higher, not an entire stack. Recreate the same decision contract. Document missing history, assets, exports, labels, and alert controls before adding extra features.
Days 31–60: run parallel measurement
Use baseline and candidate workflows against the same decisions. Compare:
- time to completed decision card;
- number of contradiction checks completed;
- alert utilization;
- reproducibility after seven days;
- data gaps and revisions;
- cost per usable decision.
Maintain the decision-utilization ledger during every parallel run. Do not reconstruct it from memory at day 60.
Do not compare a disciplined new workflow with an undocumented old habit.
Days 61–75: stress-test failure modes
Test missing data, delayed updates, label changes, API limits, noisy markets, and a week with no meaningful signal. Export the decision history and estimate the effort required to leave the platform.
Days 76–90: decide, resize, or reject
Adopt only if the candidate:
- produces positive incremental process value under conservative assumptions;
- retains required evidence quality;
- has acceptable utilization;
- survives failure tests;
- exports the artifacts needed to switch later.
If the workflow is useful but oversized, downgrade the plan, reduce metrics, or narrow alerts before committing annually.
Build versus buy thresholds
Buy a dashboard when collection is the main bottleneck, the vendor covers the required entities and assets, and saved time exceeds break-even without custom engineering.
Combine providers manually when a small number of high-impact decisions require independent methods or different evidence families, but the workflow volume does not justify automation.
Build with APIs when all five conditions are true:
- The manual workflow has produced repeatable usable decisions for at least 60 days.
- The same collection and transformation steps recur frequently.
- Latency or portfolio-wide coverage materially affects the decision.
- Someone owns data quality, failures, and human review.
- Expected annual savings or reusable-output value exceeds build and switching cost by a conservative margin.
If one condition is missing, keep the workflow manual or dashboard-based.
Build a signal go/no-go map before renewal
The on-chain signal workflows: cost and ROI guide becomes more useful when every metric has a named job. Before renewal, map each signal family to the decision it can change, the owner who reviews it, the failure mode that freezes it, and the commercial action that follows.
| Signal family | Decision it can change | Required owner | Go threshold | No-go or freeze trigger | Renewal action |
|---|---|---|---|---|---|
| Exchange flows | Weekly risk posture, venue-risk review, or reserve confidence | Research owner | Observation has venue attribution, timestamp, and contradiction check | Wallet relabeling, internal transfer ambiguity, or missing venue context | Keep only if it changes or clarifies repeated decisions |
| Long-term holder behavior | Allocation patience, cycle-context memo, or drawdown plan | Portfolio owner | Metric definition and cohort window are stable across the pilot | Retrospective cohort change cannot be reproduced from saved evidence | Keep monthly; avoid annual if methodology revisions are frequent |
| Realized profit/loss | Overheat review, rebalancing discussion, or risk-budget trim | Decision owner | Signal is paired with price structure and liquidity context | It merely explains past price action without altering the next decision | Resize metric set; do not buy more history by default |
| Stablecoin and liquidity flows | Cash deployment, liquidity watch, or tail-risk escalation | Workflow owner | Source covers relevant chains, issuers, venues, and update windows | Coverage gap hides the venue or chain that matters to the decision | Add fallback only after a removal test proves the gap is material |
| Smart-money or entity labels | Watchlist review, counterparty tracking, or narrative challenge | Analyst | Label source, confidence, and last-refresh date are saved | Labels are opaque, revised without notice, or impossible to export | Reject annual commitment unless labels are auditable |
| API alert pipeline | Continuous monitoring, dashboard refresh, or team handoff | Engineering owner | Alerts create decision cards faster than the manual baseline | Rate limit, missing-data state, or silent failure misses the decision deadline | Build only after 60+ days of manual proof and one failure drill |
This map prevents a tool from passing because one feature is impressive. Each signal family must earn its place in the workflow. A signal with no owner becomes research theater. A signal with no freeze trigger becomes false confidence. A signal with no renewal action becomes an automatic expense.
Turn the map into a renewal queue
At the monthly review, assign every signal family one status:
| Status | Definition | Action |
|---|---|---|
| Keep | It changed or clarified a documented decision and passed source controls | Keep the current tier; do not expand automatically |
| Resize | It is useful but too expensive, noisy, or broad | Reduce metrics, alerts, seats, history, or refresh frequency |
| Repair | It would be useful if one control gap closed | Fix owner, evidence fields, threshold, fallback, or export path before renewal |
| Shadow | It is interesting but not yet decision-changing | Monitor manually without using it in ROI benefit claims |
| Retire | It consumed time without changing decisions or created repeated false positives | Remove from alerts, dashboards, and renewal justification |
Require the renewal memo to include the queue. If a vendor pitch focuses on additional metrics, run those metrics through the same queue before expanding the plan. If a workflow has more Shadow and Repair items than Keep items after 90 days, the problem is not budget. The workflow is not yet operational enough to deserve an annual commitment.
Use a decision evidence packet for each Keep item
Every Keep status needs a compact packet:
- Decision card: the action or explicit no-action the signal changed or clarified.
- Source snapshot: chart, query, API response, or export with timestamp and metric definition.
- Contradiction check: price, liquidity, derivatives, news, or tail-risk evidence that challenged the interpretation.
- Cost entry: subscription, credits, analyst minutes, and maintenance minutes attributable to the signal family.
- Failure note: what would freeze the signal next month.
- Renewal action: keep, resize, renegotiate, replace, or retire.
This packet is intentionally small. If it cannot be assembled in 10 minutes after the decision, the workflow is probably not producing evidence cleanly enough for a serious ROI claim.
The 24-point adoption scorecard
Score each dimension from 0 to 3 after the pilot.
| Dimension | 0 | 1 | 2 | 3 |
|---|---|---|---|---|
| Decision relevance | No decision changes | Rare clarification | Recurring influence | Repeated material clarification |
| Speed | Slower | No change | Moderate savings | Large measured savings |
| Evidence quality | Opaque | Partial definitions | Mostly auditable | Definitions, timestamps, and revisions traceable |
| Coverage | Critical gaps | Frequent gaps | Required assets covered | Coverage plus known limitations documented |
| Reliability | Frequent failures | Unpredictable | Occasional failures | Stable with clear failure rules |
| Maintainability | High upkeep | Recurring burden | Manageable | Low recurring upkeep |
| Utilization | Most output ignored | Low use | Mixed use | Most alerts complete a review |
| Portability | Locked in | Weak exports | Partial portability | Rules and history export cleanly |
Interpretation:
- 0–10: reject or redesign.
- 11–16: keep testing; value is not proven.
- 17–20: adopt monthly and review after another quarter.
- 21–24: strong fit; consider annual pricing only after exit testing.
Build a monthly ROI control sheet before renewal
A pilot tells you whether a workflow can work. A monthly control sheet tells you whether it still works after novelty fades, markets change, and the alert queue grows. Keep one row per month and freeze the definitions before measurement begins.
| Control | Formula or test | Why it matters |
|---|---|---|
| Effective monthly cash cost | annual cash due ÷ 12 + expected overages + add-ons + taxes | Prevents a discounted headline price from hiding the real commitment |
| Fully loaded monthly cost | cash cost + analyst time + engineering + maintenance + expected error cost | Makes dashboard, API, and internal-build options comparable |
| Alert review burden | reviewed alerts × median review minutes | Exposes workflows that save collection time but create triage work |
| Alert-to-decision conversion | changed-or-clarified decisions ÷ reviewed alerts | Separates useful monitoring from notification volume |
| Evidence completeness | completed evidence fields ÷ required evidence fields | Prevents faster decisions from becoming less auditable |
| Cost per adopted decision | fully loaded cost ÷ adopted decisions | Shows whether utilization supports the selected tier |
| Decision cycle time | median minutes from question to signed decision card | Measures operational speed without claiming market returns |
| Source availability | successful scheduled checks ÷ scheduled checks | Makes reliability visible before an outage affects a decision |
An adopted decision must have an owner, timestamp, evidence link, contradiction check, conclusion, and invalidation condition. It can be an action or an explicit no-action. If the workflow merely produced a chart or alert, it did not produce an adopted decision.
Use a fixed monthly review:
- Reconcile the invoice, credits, overages, seats, and add-ons.
- Export alert, query, and source-health logs.
- Match each adopted decision to the evidence that changed or clarified it.
- Audit a sample of rejected alerts for missed information.
- Recalculate process value using the same baseline rates.
- Record incidents, label revisions, missing history, and manual workarounds.
- Decide whether to keep, resize, renegotiate, replace, or retire the workflow.
This turns renewal from a preference vote into an auditable operating decision.
Add an ROI operating dashboard with stop, resize, and scale triggers
A monthly control sheet records what happened. An ROI operating dashboard converts those observations into a decision rule. Without thresholds, teams often keep an oversized plan because it feels useful, tolerate a noisy alert stream because some alerts are valuable, or renew an API because the integration cost has already been paid.
Build the dashboard before the pilot starts. Give every metric a baseline, an acceptable range, a warning threshold, a stop threshold, an owner, and a response. Do not invent universal targets. Use the current workflow as the baseline and set thresholds that match the decision's materiality, frequency, and evidence requirements.
| Operating metric | Formula | Warning signal | Required response |
|---|---|---|---|
| Decision adoption rate | adopted decisions ÷ completed research cycles | Falls below the baseline for two review periods | Reduce metrics and alerts; recheck the decision contract |
| Alert precision proxy | reviewed alerts that changed or clarified a decision ÷ reviewed alerts | Review burden rises while useful alerts stay flat | Tighten routing, thresholds, assets, or entity filters |
| Benefit realization rate | observed qualified benefit ÷ forecast qualified benefit | Falls below the pilot assumption | Reforecast ROI with observed utilization; resize the plan |
| Evidence completeness | completed required evidence fields ÷ required fields | Any decline that affects reproducibility | Freeze automation or confidence until the gap is repaired |
| Source availability | successful required checks ÷ scheduled required checks | Breaches the workflow's decision deadline | Activate fallback source or freeze affected decisions |
| Provider concentration | adopted decisions relying on the largest single provider ÷ all adopted decisions | One provider becomes a critical untested dependency | Add a fallback test, not automatically another subscription |
| False-positive burden | rejected-alert review hours + rework hours | Consumes the time the workflow was expected to save | Reduce alert volume before buying more capacity |
| Cost per adopted decision | fully loaded monthly cost ÷ adopted decisions | Exceeds the approved ceiling | Downgrade, renegotiate, redesign, or retire |
The important distinction is between a warning and a stop. A warning starts diagnosis. A stop freezes a specific workflow use until evidence quality, reliability, or economics return to an acceptable range.
Use hard stop rules for control failures, not for ordinary month-to-month noise. Examples include:
- a required source misses the decision deadline and no tested fallback exists;
- evidence completeness falls below the minimum needed to reproduce the conclusion;
- a label or metric definition changes without a documented version note;
- the workflow exceeds its approved cash limit or API credit ceiling;
- the same alert class creates repeated false positives without a rule change;
- an annual upgrade depends on benefits that were forecast but never observed.
Calculate benefit leakage instead of defending the forecast
Most ROI models fail because forecast benefits silently leak between the spreadsheet and actual use. Track that leakage explicitly.
Benefit realization rate
= observed qualified benefit ÷ forecast qualified benefit

Benefit leakage
= 1 - benefit realization rate
Suppose a dashboard was expected to save 20 analyst hours per month, valued at $60 per hour. The forecast benefit was $1,200. After three months, logs show that it removed 14 collection hours but added six hours of alert review and two hours of reconciliation. Net qualified time saved was six hours, or $360.
Benefit realization rate = $360 ÷ $1,200 = 30%
Benefit leakage = 70%
The right response is not to keep the $1,200 forecast because the tool remains popular. Recalculate the business case with $360, then identify the leakage source: unused features, duplicate checks, alert noise, training gaps, or a decision that occurs less often than expected.
Price false positives as operating cost
A false positive is not only an incorrect alert. For ROI measurement, count any alert that requires review but fails to change, clarify, or explicitly close the defined decision. The cost includes triage, context gathering, duplicate verification, escalation, and rework.
Monthly false-positive burden
= rejected alerts × median review minutes ÷ 60 × loaded hourly rate
+ rework hours × loaded hourly rate
If 80 rejected alerts require a median of six minutes each and the loaded review rate is $60 per hour, triage costs $480. If the workflow also creates three hours of rework, the full monthly burden is $660. A $199 dashboard is therefore not a $199 workflow.
Do not optimize this metric by ignoring alerts. Pair it with source coverage and a sample audit of rejected alerts. The goal is a smaller, higher-value queue—not an artificially high precision number created by under-review.
Convert downtime into decision cost
Availability matters only in relation to the decision deadline. A source can report high monthly uptime and still fail during the one research window that matters.
Track downtime at the workflow level:
Decision-weighted downtime cost
= affected decision cycles × fallback labor cost
+ delayed-decision cost approved in the decision contract
+ reconstruction and reconciliation cost
Do not assign speculative market losses to downtime. Use only documented process costs: paid fallback access, manual reconstruction, duplicated analyst work, delayed publication, or a frozen decision that had a pre-approved operational value.
Measure provider concentration before adding redundancy
Multiple subscriptions do not automatically create resilience. Two dashboards may depend on the same underlying data or use similar labels. Measure concentration by adopted decision, not provider count.
Provider concentration ratio
= adopted decisions materially dependent on the largest provider
÷ total adopted decisions
Then run a removal test: hide the primary provider for one research cycle and record which decisions continue, degrade, or freeze. If the alternative source cannot reproduce the evidence within the deadline, it is not a functional fallback.
Use an operating decision tree each month
Apply the dashboard in this order:
- Stop if a critical evidence, definition, licensing, or reliability control fails.
- Repair if economics are acceptable but alert noise, training, or routing causes leakage.
- Resize if the workflow is useful but cost per adopted decision exceeds the approved ceiling.
- Renegotiate if utilization is stable but pricing, credits, seats, or billing terms create the gap.
- Scale only when adoption, evidence completeness, reliability, and stress-case ROI all pass.
- Retire when two consecutive review periods show weak adoption and no specific repair closes the gap.
This decision tree prevents sunk-cost reasoning. Setup effort and integration expense belong in the historical record, but future renewal should depend on future qualified value, control quality, and exit cost.
Worked monthly dashboard
Consider a research workflow with $450 in monthly subscription and API cost, 18 operating hours at $60 per hour, and $120 in expected error and fallback cost. Fully loaded monthly cost is $1,650. It produces 11 adopted decisions from 44 reviewed alerts.
| Metric | Result | Interpretation |
|---|---|---|
| Alert-to-decision conversion | 25% | One in four reviewed alerts reaches the decision record |
| Cost per adopted decision | $150 | Compare with the ceiling approved before the pilot |
| Evidence completeness | 96% | Investigate the missing fields before automation expands |
| Source availability | 98% | Accept only if missed checks did not breach decision deadlines |
| Provider concentration | 73% | Run a primary-provider removal test |
| Forecast qualified benefit | $2,400 | Locked before the month began |
| Observed qualified benefit | $1,980 | Based on logged time, rework, and reusable outputs |
| Benefit realization rate | 82.5% | Reforecast future months at the observed rate |
At face value, qualified process value is $330 before any confidence haircut. The workflow should not scale yet because provider concentration is high and evidence completeness is below 100%. The next action is a fallback test and evidence repair—not a larger plan.
Add these dashboard results to the renewal memo. A buyer should be able to see, in one page, what the workflow cost, what it changed, where expected value leaked, which controls failed, and why the next decision is keep, resize, renegotiate, replace, or retire.
Run three sensitivity tests before an annual commitment
A positive base-case spreadsheet is not enough. Test whether the conclusion survives weaker utilization, higher labor cost, and service disruption.
Test 1: adoption falls by half
Cut changed-or-clarified decisions by 50% while holding costs constant. This models alert fatigue, staff turnover, quieter markets, or a workflow that depends on one power user. If cost per adopted decision becomes unacceptable, choose a monthly plan, smaller tier, or shorter commitment.
Test 2: hidden labor doubles
Double alert review, data cleaning, and maintenance hours. API workflows often look cheap when engineering and incident response are excluded; manual workflows look cheap when analyst collection time is treated as free. The doubled-labor case reveals whether the purchase only works under optimistic staffing assumptions.
Test 3: the primary source is unavailable
Remove the main provider for one decision cycle. Document which decisions freeze, which continue with lower confidence, and which can use a second source. Count the cost of fallback access and manual reconstruction. A workflow with strong nominal ROI but no defined failure mode can be operationally fragile.
Use this renewal rule:
Renew only if:
1. base-case incremental process ROI is positive,
2. evidence completeness does not decline,
3. at least two of three stress cases remain acceptable,
4. no unresolved critical source or licensing risk exists, and
5. the next tier's added cost maps to a measured bottleneck.
Do not upgrade for unused limits, broader metric catalogs, or vague future automation. Upgrade only when the control sheet identifies a specific constraint: history, latency, resolution, seats, exports, API throughput, licensing, or collaboration.
Use a procurement-to-renewal decision memo
The final output should fit on one page:
| Field | Required entry |
|---|---|
| Decision contract | The exact portfolio, risk, research, or monitoring decision the workflow supports |
| Baseline | Current monthly cash cost, labor hours, cycle time, and evidence completeness |
| Candidate | Plan, billing term, included limits, expected overages, seats, licensing, and exit terms |
| Observed value | Time removed, rework avoided, adopted decisions, reusable outputs, and control gaps closed |
| Reliability | Availability, lag, label changes, incidents, and fallback performance |
| Economics | Base, downside, and stress-case process ROI; cost per adopted decision |
| Recommendation | Keep, resize, renegotiate, replace, retire, or defer |
| Next review | Owner, date, renewal notice deadline, and evidence required |
The memo should cite raw logs and decision cards, not retrospective impressions. For teams, require sign-off from the workflow owner and the person accountable for the affected decision. For individuals, use the same structure as a forced pause before an annual purchase.
Red flags in on-chain analytics ROI claims
Reject a workflow business case when it:
- counts all portfolio gains after adoption as tool-generated value;
- presents backtested or hypothetical performance as expected returns;
- excludes analyst time, setup, maintenance, or alert review;
- counts alerts delivered rather than alerts used;
- treats correlated metrics as independent confirmations;
- assumes historical labels were known in real time;
- ignores API credits, overages, licensing, or taxes;
- compares different decisions or market periods;
- values saved time that was not actually redeployed;
- hides unused metrics and ignored alerts;
- assumes queries, labels, and decision history are portable;
- compares vendor quotes without normalizing overages, seats, or cash due;
- counts alerts instead of adopted decisions;
- records decisions without reproducible evidence links;
- requires more tools to verify than it replaces.
Investor.gov's crypto-assets spotlight emphasizes that crypto asset investments carry significant risk and require careful evaluation. That is another reason to evaluate an analytics workflow as a research process—not as a promise of returns.
Which tier should you choose?
Choose Tier 1 if decisions are infrequent and a small worksheet can keep the process consistent.
Choose Tier 2 if measured manual collection exceeds the plan's break-even hours or if deeper history, alerts, and exports close a required control gap.
Choose Tier 3 if the decision requires source challenge across on-chain, spot, derivatives, liquidity, and event evidence.
Choose Tier 4 if the manual process is proven, monitoring must run continuously, and engineering plus human review have clear owners.
The correct cost and ROI decision is not “buy the most data.” It is “pay for the smallest system that produces a faster, traceable, and falsifiable decision.” Use this on-chain signal workflows: cost and ROI guide as a control sheet before you approve a new dashboard, API, or annual renewal.
Revisit the on-chain signal workflows: cost and ROI guide at every renewal date, because the right answer can change when usage, credits, source reliability, or decision volume changes.
BTCMind follows that research-desk model: specialized AI analysts examine different evidence families, debate competing interpretations, and compress the result into a mobile brief. Explore BTCMind and get the app to compare an agent-assisted desk with your current manual stack.
Frequently asked questions
How much do on-chain analytics tools cost?
Costs range from free public dashboards to paid individual plans, credit-metered APIs, and custom institutional contracts. Compare full monthly ownership—including research time, maintenance, overages, and switching—not only the headline subscription.
What is a good ROI for an on-chain analytics tool?
There is no universal target. Look for positive, repeatable incremental process ROI after all cash and labor costs. The workflow should also preserve evidence quality and reduce avoidable errors.
What is cost per usable decision?
Divide full workflow cost by documented decisions the workflow changed or clarified. Exclude charts viewed, alerts opened, and notes that never reached an action or explicit no-action.
Can on-chain signals predict crypto prices?
No single on-chain signal reliably predicts price. Blockchain activity still requires attribution and market context. Confirm it with price structure, liquidity, derivatives, and event risk.
When should I use an API instead of a dashboard?
Use an API after the manual workflow is proven, repeated collection is the bottleneck, latency matters, and someone owns data quality and failures. Do not automate a metric you cannot explain or audit.
How do I calculate break-even for a paid plan?
Divide incremental monthly cash cost by the value of one useful decision hour. Then verify that the saved hours are measured, repeatable, and actually redeployed.
Should I use more than one on-chain data provider?
Use multiple providers when methodology, labels, asset coverage, or evidence type creates a material blind spot. Do not add a provider only to duplicate the same derived metric.
How should I compare annual and monthly on-chain analytics plans?
Calculate both the monthly equivalent and the cash due at purchase. Include expected overages, seats, add-ons, taxes, setup time, and the cancellation window. An annual plan should pass the incremental ROI test and a separate cash-commitment test.
What should an on-chain analytics renewal memo include?
Include the decision contract, baseline cost and cycle time, normalized vendor terms, adopted decisions, evidence completeness, source reliability, base and stress-case process ROI, recommendation, owner, and renewal notice deadline.
When should I cancel or downgrade an on-chain analytics workflow?
Cancel, downgrade, or keep monthly terms when decision adoption is low, evidence is not reproducible, alert review takes more time than it saves, source downtime hits decision windows, cost per adopted decision exceeds the approved ceiling, or exports cannot preserve the evidence trail.
What is a good decision-utilization rate?
There is no universal benchmark. Establish the baseline for your own research cycle, then require the candidate workflow to improve changed-or-clarified decisions, evidence completeness, or decision time without increasing misleading outputs. The direction and repeatability of improvement matter more than an arbitrary percentage.
What should I instrument before measuring on-chain analytics ROI?
Track source health, alert reviews, decision cards, and fully loaded cost for at least one monthly cycle. Those four logs produce the inputs needed for cost per adopted decision, benefit leakage, false-positive burden, and source-availability controls.
This article is educational and does not provide investment, legal, tax, or financial advice. Crypto assets are volatile, and data can be delayed, incomplete, or revised.