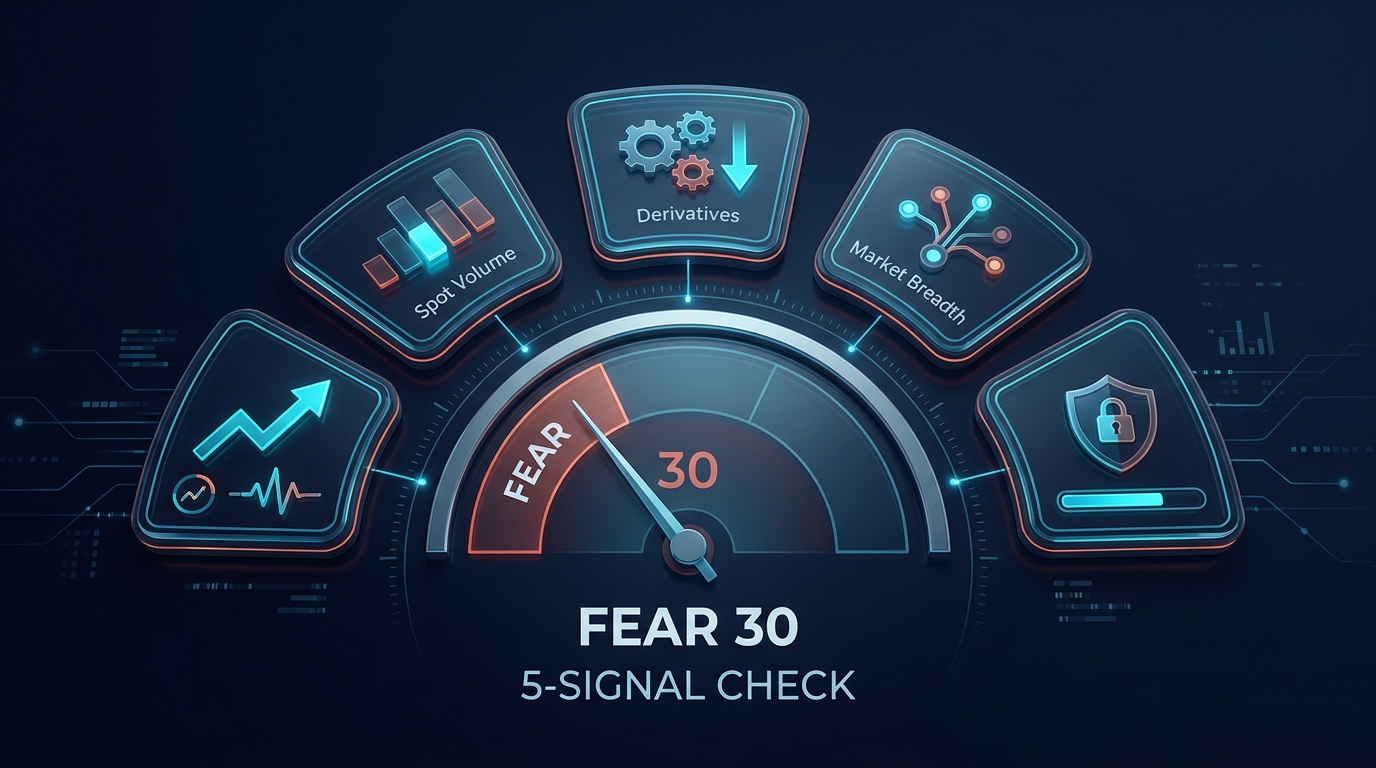
The Crypto Fear and Greed Index is easy to read and easy to misuse. A low number can persist while Bitcoin keeps falling. A high number can remain elevated while a strong trend continues. The gauge describes the market's emotional backdrop; it does not identify an entry, position size, or invalidation level.
A more disciplined fear and greed index trading strategy treats sentiment as the first check in a sequence. Before acting, confirm the reading against price structure, spot participation, derivatives positioning, market breadth, and a predefined risk plan.
This guide turns those checks into a repeatable five-signal matrix. It is an educational research framework, not a mechanical buy-or-sell system and not financial advice.
The short version
Use the index to answer one question: What emotional regime is the market in? Then use independent evidence to decide whether that emotion is being reinforced or rejected.
| Index backdrop | Other evidence | Research interpretation |
|---|---|---|
| Fear | Structure and participation improve | Possible stabilization; wait for a defined confirmation and invalidation |
| Fear | Structure, breadth, and flows weaken | Fear is being confirmed; do not assume “cheap” means finished falling |
| Greed | Trend and spot demand remain healthy | Momentum may still be intact, but risk discipline matters more |
| Greed | Price stalls while leverage expands | Crowding or distribution risk deserves closer review |
The index should change the questions you ask, not make the decision for you.
Sentiment snapshot: July 27, 2026
The Alternative.me Crypto Fear and Greed Index printed 30, classified as Fear, on July 27, 2026. Its previous seven daily readings were 26, 27, 28, 31, 33, 25, and 29.
| Date | Reading | Classification |
|---|---|---|
| July 27, 2026 | 30 | Fear |
| July 26, 2026 | 26 | Fear |
| July 25, 2026 | 27 | Fear |
| July 24, 2026 | 28 | Fear |
| July 23, 2026 | 31 | Fear |
| July 22, 2026 | 33 | Fear |
| July 21, 2026 | 25 | Extreme Fear |
| July 20, 2026 | 29 | Fear |
The seven-day average through July 27 was approximately 28.6. The latest reading was four points above the prior day but only one point above the July 20 reading. That is a useful distinction: sentiment improved for one day, but the multi-day regime remained fearful.
The snapshot comes from the index's public API. Because the value updates over time, always date-stamp any reading used in a journal, backtest, or research brief.
What the index measures—and what it does not
Alternative.me describes the index as a 0-to-100 measure built from several inputs, including volatility, market momentum and volume, social media, Bitcoin dominance, and Google Trends. Its published methodology currently lists surveys as paused.
That design makes the gauge a composite sentiment proxy. It is useful because it compresses several emotional and market-behavior inputs into one number. It is limited because the number hides the details underneath.
The index does not directly tell you:
- whether price has reclaimed a broken level;
- whether a move is led by spot buyers or leveraged derivatives;
- whether strength is broad or concentrated in a few large assets;
- where a trade thesis is wrong;
- how much capital can be risked safely;
- whether fear or greed will reverse tomorrow.
For a fuller introduction to the calculation and basic interpretation, start with our guide to the Crypto Fear and Greed Index for sentiment checks. The matrix below is the next step: converting the backdrop into a structured confirmation process.
The five-signal confirmation matrix
Score each signal from 0 to 2. A score of 0 means the evidence contradicts the setup, 1 means it is mixed, and 2 means it confirms the setup. The score is not a forecast. It is a forcing function that prevents one dramatic headline or one attractive index reading from dominating the entire decision.
Signal 1: Sentiment regime and rate of change
Start with the current index level, but do not stop there. Record:
- today's reading and classification;
- the prior day's reading;
- the seven-day average;
- the seven-day high and low;
- whether the reading crossed into or out of an extreme band.
The July 27 snapshot shows why this matters. A move from 26 to 30 looks like improvement, but the seven-day average remained below 30 and every daily observation in the sample was classified as Fear or Extreme Fear. The correct description is “fear with a one-day improvement,” not “sentiment reversal.”
| Score | Sentiment evidence |
|---|---|
| 0 | One isolated reading conflicts with the proposed thesis or the regime is deteriorating |
| 1 | The level supports the thesis, but the multi-day direction is mixed |
| 2 | The level, rate of change, and multi-day regime all support the same interpretation |
Signal 2: Price structure
Sentiment becomes more useful when price confirms that market participants are acting differently.
For a bullish stabilization thesis, look for evidence such as a reclaimed breakdown level, a higher low on the chosen timeframe, or repeated rejection of lower prices. For a bearish exhaustion or distribution thesis, look for failed breakouts, lower highs, or a loss of support after an extended advance.
Use the same timeframe for the sentiment thesis and the chart confirmation. A daily sentiment reading paired with a five-minute chart can manufacture false precision. If the decision horizon is several days, evaluate daily structure and define the level that invalidates the thesis.
The BTC key-levels framework explains how to convert a visible level into an actual invalidation plan.
| Score | Structure evidence |
|---|---|
| 0 | Price continues to invalidate the setup |
| 1 | Price is stabilizing but has not reclaimed or lost the decision level |
| 2 | Price confirms the setup with a clear close, retest, or structural break |
Signal 3: Spot participation and volume quality
A price move is more persuasive when actual market participation expands with it. Compare spot volume with a relevant baseline, such as the 20-day median, and ask whether the move holds after the initial impulse.
Avoid treating raw reported volume as proof by itself. Review multiple liquid venues where possible, distinguish spot from perpetual-futures activity, and note whether volume expands on the confirming move or only during the selloff that preceded it.
For a fear-based recovery thesis, a bounce on weak spot participation deserves less confidence than a reclaim supported by sustained spot demand. For a greed-based warning thesis, heavy volume with little upward progress can be more informative than the high index reading alone.
| Score | Participation evidence |
|---|---|
| 0 | Move lacks spot follow-through or reverses quickly |
| 1 | Participation is near baseline or inconsistent across venues |
| 2 | Spot activity expands and price holds the confirmed level |
Signal 4: Derivatives positioning
Open interest and funding help identify whether leverage is supporting or destabilizing the move. They should be read together with price, not in isolation.
Rising price plus rising open interest can reflect new positioning, but it does not reveal whether the new exposure is healthy or crowded. Falling price plus rising open interest can indicate aggressive shorting or trapped longs depending on the surrounding structure. Funding adds another clue by showing which side is paying to maintain exposure.
Use the open-interest analysis guide and the Bitcoin funding-rate framework to separate leverage confirmation from leverage risk.
| Score | Derivatives evidence |
|---|---|
| 0 | Leverage is expanding against the thesis or liquidation risk is elevated |
| 1 | Open interest and funding are inconclusive |
| 2 | Positioning supports the thesis without an obvious crowding extreme |
Signal 5: Market breadth and leadership
The Alternative.me index is explicitly Bitcoin-centered. A reading can describe Bitcoin sentiment reasonably well while saying less about the condition of the broader crypto market.
Check whether the proposed move is broad or narrow. Depending on the thesis, review:
- the share of tracked assets above short- and medium-term moving averages;
- advance-versus-decline counts;
- whether major altcoins confirm Bitcoin's direction;
- Bitcoin dominance and stablecoin-market behavior;
- whether gains are concentrated in a small group of illiquid tokens.
A Bitcoin bounce during Fear is stronger evidence of market repair when breadth also improves. A Bitcoin bounce with deteriorating breadth may be defensive rotation rather than broad risk appetite.
| Score | Breadth evidence |
|---|---|
| 0 | Leadership is narrow and most tracked assets contradict the thesis |
| 1 | Breadth is mixed or Bitcoin-only |
| 2 | Multiple liquid assets and breadth measures confirm the move |
How to read the total score
Add the five scores for a maximum of 10.
| Total | Interpretation | Appropriate research response |
|---|---|---|
| 0–4 | Weak confirmation | Do not let the index override contradictory market evidence |
| 5–7 | Mixed confirmation | Reduce confidence, wait for a cleaner trigger, or narrow the thesis |
| 8–10 | Strong confirmation | The evidence is aligned enough to write a full plan—but risk controls still decide whether the setup is actionable |
This range is a BTCMind checklist convention, not a scientifically validated prediction model. If you use it repeatedly, preserve your historical scores and outcomes. That record can show whether a signal adds value for your timeframe or merely creates a compelling story after the fact.
The mandatory risk gate
Do not place the risk plan inside the ten-point score. A setup should not earn permission to proceed merely because it accumulated enough analytical points.
Before any action, define:
- Trigger: What exact event confirms the thesis?
- Invalidation: What price, close, or market condition proves it wrong?
- Maximum loss: What fixed amount or portfolio percentage can be lost?
- Position size: What size fits the invalidation distance and maximum loss?
- Exit logic: What causes a partial exit, full exit, or time-based review?
- Data failure: What happens if an exchange feed, index input, or price source is unavailable?
If any answer is missing, the research is incomplete regardless of the matrix score. The crypto portfolio risk-management framework provides a practical approach to stop distance, position caps, and rebalancing triggers.
Four common fear-and-greed setups
1. Fear plus improving structure
The index remains low, but price reclaims a major level, spot participation expands, leverage stays controlled, and breadth improves. This is a stabilization candidate, not proof of a bottom. The main risk is entering before the structural confirmation is complete.
2. Fear plus deteriorating structure
The index is low and price continues making lower lows while breadth weakens. Fear is being confirmed by the market. The common error is assuming that extreme emotion must create an immediate reversal.
3. Greed plus healthy participation
The index is elevated, but spot demand remains broad and the trend continues to respect support. Greed alone is not a short signal. The useful response is to tighten the research process: avoid expanding size because of recent gains and monitor for leverage crowding.
4. Greed plus leverage divergence
The index is high, price progress slows, open interest expands, funding becomes one-sided, and breadth narrows. The evidence does not guarantee a reversal, but it does identify a fragile setup that deserves smaller assumptions and clearer invalidation.
A daily sentiment-check workflow
- Time-stamp the index. Save the value, classification, and source URL.
- Calculate context. Record the one-day change, seven-day average, and recent range.
- Write one neutral sentence. Example: “Sentiment remains fearful, with a modest one-day improvement.”
- Mark price structure. Identify the trigger and invalidation on the decision timeframe.
- Review spot participation. Compare the confirming move with a consistent volume baseline.
- Check derivatives. Review price, open interest, funding, and liquidation risk together.
- Check breadth. Confirm whether the move extends beyond Bitcoin or a few leaders.
- Score the five signals. Preserve each component score, not only the total.
- Apply the risk gate. Reject any plan without size, invalidation, and exit logic.
- Schedule the next review. Do not keep changing the thesis every time the gauge moves one point.
This workflow can fit into a compact research brief. The purpose is not to produce more indicators. It is to make every conclusion traceable.
Where BTCMind fits
BTCMind is designed as an AI crypto research desk rather than a one-number signal service. A sentiment reading can enter the research process, but it should be debated against structure, derivatives, breadth, catalysts, and risk before it becomes a conclusion.
That adversarial process matters most when the market feels obvious. Fear encourages urgency to buy a perceived bargain. Greed encourages urgency to chase. A structured brief slows both reactions down and preserves the evidence behind the final call.
Explore BTCMind or download the app to keep sentiment, market structure, derivatives, and risk checks in one mobile workflow.
Final take
The best use of the Crypto Fear and Greed Index is not “buy fear, sell greed.” It is identify the emotional regime, then demand independent confirmation.
On July 27, 2026, a reading of 30 showed that the market remained in Fear despite a four-point daily improvement. That observation is useful. It becomes decision-quality research only after price structure, spot participation, derivatives positioning, breadth, and a complete risk plan agree with the thesis.
FAQ
Is the Fear and Greed Index a trading strategy?
No. It is a sentiment input. A usable strategy still needs a defined market, timeframe, trigger, invalidation, position-sizing rule, and exit process.
Does extreme fear mean crypto is about to rise?
No. Extreme fear can persist while prices continue falling. Treat it as evidence of the emotional regime and wait for independent confirmation from structure and participation.
What indicators should I combine with the Crypto Fear and Greed Index?
Useful confirmation categories include price structure, spot volume, open interest, funding, breadth, Bitcoin dominance, and a predefined risk plan. Avoid adding indicators that measure the same behavior repeatedly.
How often should I check the index?
Match the review schedule to the strategy timeframe. For swing research, one consistent daily check is usually more coherent than reacting to every intraday price move.
What did a reading of 30 mean on July 27, 2026?
Alternative.me classified 30 as Fear. The prior seven readings ranged from 25 to 33, so the broader sample remained fearful even though the index improved by four points from July 26.