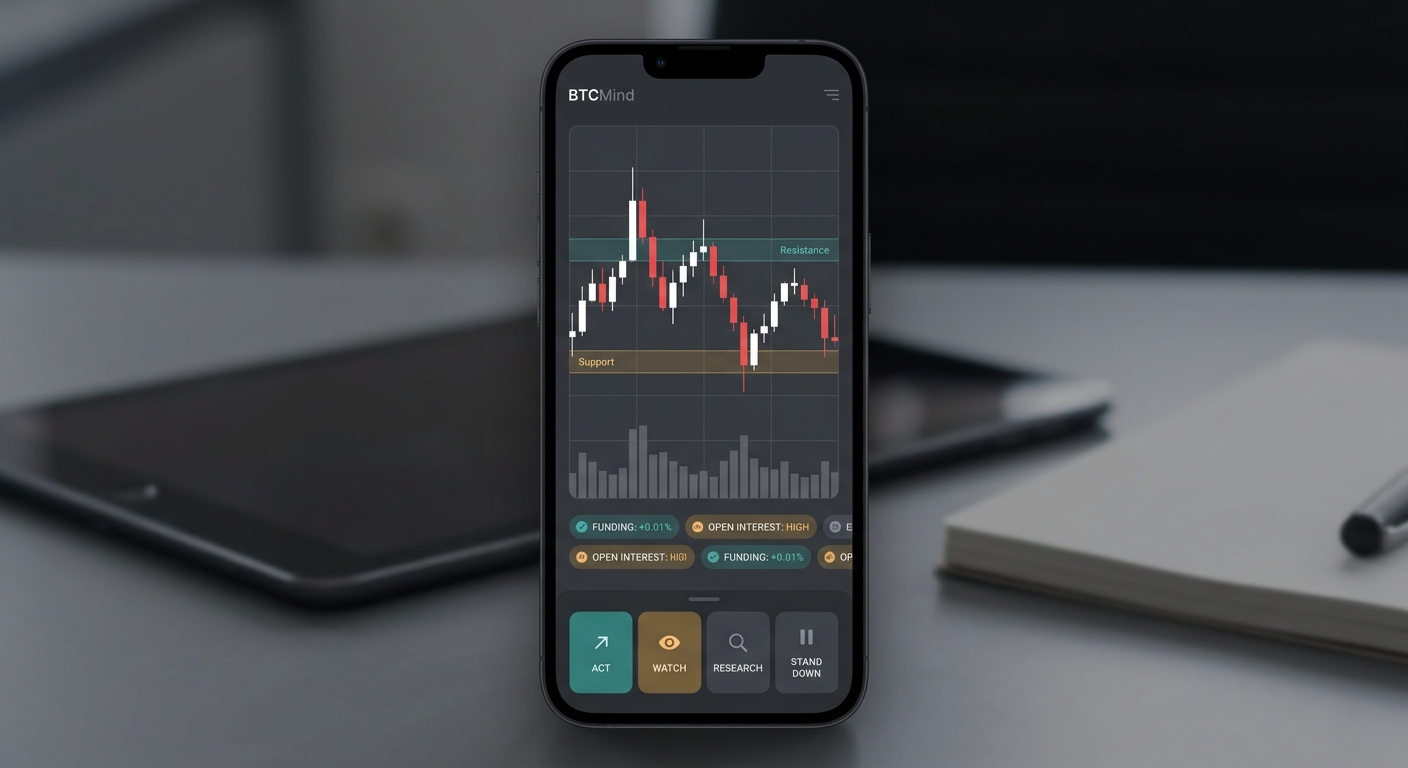
BTC price analysis is the structured review of Bitcoin's price action, momentum, market structure, liquidity, derivatives signals, and risk context before making a trade, changing exposure, or deciding to wait.
Good BTC price analysis does not mean predicting the next candle. It means answering a narrower question: "What would have to happen for this Bitcoin move to matter to my decision?"
That distinction matters because Bitcoin trades around the clock, moves fast, and can punish vague conviction. Bitcoin.org warns that Bitcoin's price can rise or fall unpredictably over short periods and should be treated as a high-risk asset. The CFTC also warns that virtual currency markets can be volatile and that leverage can amplify losses. A BTC price analysis workflow should respect that reality. It should narrow the decision, define invalidation, and keep the trader from turning a chart into a story after the fact.
BTCMind approaches BTC price analysis as a research desk problem, not a single-indicator problem. The product uses six AI specialists across technical analysis, derivatives, tail-risk, historical reflection, bull case, bear case, and portfolio-manager synthesis. The goal is not to make the chart louder. The goal is to turn price movement into a traceable decision card.
BTC price analysis, in one sentence
BTC price analysis is a repeatable process for translating Bitcoin price movement into a decision: act, watch, research further, or stand down.
That process usually combines five layers:
| Layer | What it checks | Why it matters |
|---|---|---|
| Price structure | Trend, range, breakout, breakdown, support, resistance | Shows whether BTC is moving cleanly or chopping inside noise |
| Momentum | RSI, MACD, moving averages, rate of change | Tests whether the move has strength or is losing force |
| Volume and liquidity | Spot volume, order-book depth, wick behavior, failed auctions | Separates accepted moves from thin moves |
| Derivatives context | Funding, open interest, liquidations, basis | Shows whether leverage is crowded or confirming the move |
| Risk and invalidation | Stop area, loss at invalidation, time stop, position size | Converts analysis into a bounded decision |
The mistake is treating any one layer as the answer. RSI can show momentum, but it does not prove a trade. MACD can show trend and momentum changes, but it does not know your time horizon. Support and resistance can define areas of interest, but they do not guarantee a bounce or rejection. BTC price analysis matters when these layers agree or clearly disagree in a way that changes the decision.
What BTC price analysis can and cannot tell you
BTC price analysis can tell you:
- Whether Bitcoin is trending, ranging, compressing, or rejecting a level.
- Which levels would change the current read.
- Whether momentum supports or contradicts the move.
- Whether a breakout is being accepted or fading.
- Whether the risk/reward is clear enough to act.
- Where the trade idea is wrong.
BTC price analysis cannot tell you:
- The exact future Bitcoin price.
- Whether a news event will land before your stop.
- Whether a whale, exchange outage, ETF flow, liquidation cascade, or macro surprise will appear.
- Whether a signal is worth taking without your own risk budget.
- Whether leverage is safe.
That is why a useful BTC price analysis guide should end in a conditional plan, not a confident forecast.
Bad output: "BTC looks bullish."
Good output: "BTC is constructive above the reclaimed range high. If the next two four-hour closes hold above that level while funding stays neutral and spot volume confirms, the plan is to scale in. If price loses the reclaim and open interest rises into the drop, the signal is invalidated."
When BTC price analysis matters most
You do not need full BTC price analysis every time Bitcoin moves 0.5%. The workflow matters most when the decision cost is high.
1. Before entering a new position
Run BTC price analysis before a new entry if the trade would materially change your exposure. At minimum, define:
- The setup: trend continuation, range trade, breakout, breakdown, mean reversion, or hedge.
- The invalidation level.
- The maximum loss if invalidation hits.
- The time horizon.
- The evidence that would make you avoid the trade.
If you cannot name what would make you wrong, you are not doing analysis. You are reacting.
2. When BTC reaches a major support or resistance zone
Price analysis becomes useful when BTC is near a level where other traders may act. That can include prior range highs, prior range lows, trendline clusters, moving average areas, weekly opens, monthly opens, or liquidation-heavy zones. If you need a deeper level-marking method, start with the Bitcoin support and resistance for beginners framework before adding indicators.
The key question is not "Is this support?" The better question is: "What would acceptance or rejection look like here?"
A clean level decision needs three parts:
| Zone behavior | Meaning | Action bias |
|---|---|---|
| Fast reclaim after sweep | Liquidity grab may have failed | Watch for continuation confirmation |
| Multiple closes above level | Buyers may be accepting higher prices | Consider a conditional long plan |
| Rejection with rising leverage | Move may be crowded or fragile | Reduce size or stand down |
| Choppy overlap around level | Level is not clean enough | Wait for a better signal |
This is where BTC price analysis helps a trader avoid treating every line on a chart as equally important.
3. After a breakout or breakdown
Breakouts attract attention, but many fail. BTC price analysis matters immediately after a breakout because the first move is only the invitation. The acceptance test is what comes next.
Ask:
- Did BTC close above or below the level, or only wick through it?
- Did volume expand, or did the move happen in thin conditions?
- Did open interest rise in the same direction, suggesting leverage is joining?
- Is funding already stretched?
- Did the prior resistance become support, or did price fall back inside the old range?
The strongest BTC price analysis does not chase the candle. It waits for proof that the market accepted the new area.
4. When momentum conflicts with price
Momentum conflict is one of the best reasons to slow down. TradingView describes RSI as a momentum oscillator that tracks the speed and magnitude of directional price movement. TradingView describes MACD as a momentum indicator based on the relationship between moving averages.
Those indicators are useful because they can reveal disagreement between price and momentum. For example:
- BTC makes a higher high, but momentum makes a lower high.
- BTC breaks down, but downside momentum fades.
- BTC ranges sideways while momentum compresses.
- BTC rallies while volume dries up.
None of these is a trade by itself. But each is a reason to run a deeper BTC price analysis check before adding risk.
5. Before adding leverage
Leverage is where BTC price analysis becomes risk analysis. The CFTC warns that leverage amplifies risk and can force traders to add margin or close positions when markets move against them. For a fuller risk lens, pair price structure with crypto risk management metrics.
Before adding leverage, the question is not just "Is the chart right?" It is:
- Where is liquidation relative to invalidation?
- How much can BTC move against the position before the thesis is wrong?
- Is funding making the trade more expensive?
- Is open interest rising into a crowded move?
- What happens if BTC wicks through the level and immediately reclaims?
If the liquidation level is closer than the real invalidation level, the trade structure is broken even if the analysis is directionally reasonable.
6. When a news move looks obvious
Bitcoin news moves often feel clean in the first few minutes. They rarely stay clean. BTC price analysis matters after news because price action can separate immediate reaction from durable acceptance. A news spike can also trigger alert fatigue, so route major levels through bitcoin alerts workflows instead of watching every tick.
Use a news-move checklist:
| Check | Question |
|---|---|
| First reaction | Did BTC impulse in one direction or whipsaw both sides? |
| Second test | Did the market hold the first breakout/breakdown area? |
| Volume | Did participation expand after the headline? |
| Derivatives | Did leverage chase the move? |
| Risk | Is the stop based on structure or emotion? |
If the only evidence is "the headline sounds bullish," stand down until the chart gives a cleaner read.
7. During a portfolio review
BTC price analysis is not only for active traders. Long-term holders can use it to avoid blind rebalancing.
For a weekly or monthly review, ask:
- Is BTC still above the level that supported the original allocation?
- Has volatility changed enough to alter position size?
- Has the portfolio become too concentrated after a large move?
- Are alerts still tied to meaningful levels?
- Has the reason for holding changed, or only the price?
The output may be "do nothing." That is still a decision if the evidence supports it. For a broader setup routine, use the Bitcoin market intelligence beginner guide as the operating context around the chart.
The BTC price analysis timing matrix
Use this matrix to decide how much analysis the situation deserves.
| Situation | Minimum check | Full workflow needed? | Best output |
|---|---|---|---|
| Small move inside range | Range position and alert status | No | Watch |
| BTC near major level | Acceptance/rejection and volume | Yes | Conditional plan |
| Breakout or breakdown | Close, retest, momentum, derivatives | Yes | Act or stand down |
| Momentum divergence | Price structure plus RSI/MACD context | Usually | Research further |
| Adding leverage | Invalidation, liquidation, funding, OI | Always | Risk card |
| News-driven spike | First reaction, second test, source check | Yes | Wait or reduce size |
| Weekly holder review | Allocation, volatility, major levels | Sometimes | Hold, rebalance, or alert |
The point is discipline. BTC price analysis should scale with the decision. A tiny portfolio note does not need a full research memo. A leveraged trade does.
A 10-minute BTC price analysis workflow
Use this when BTC is moving and you need a decision without turning the process into chart-watching.
Minute 0-1: Define the decision
Write one sentence:
"I am deciding whether to [enter/add/reduce/hold/avoid] BTC over [time horizon]."
No decision, no analysis. If you cannot name the decision, you are just collecting signals.
Minute 1-3: Mark the structure
Identify:
- Current trend or range.
- Nearest support.
- Nearest resistance.
- Last failed breakout or breakdown.
- The level that would change your read.
Do not draw ten lines. Draw the two or three that matter.
Minute 3-5: Check momentum
Look for agreement or conflict:
- Is price making higher highs and higher lows?
- Is RSI confirming strength or warning of exhaustion?
- Is MACD supporting trend continuation or fading?
- Are moving averages aligned with the timeframe you trade?
Momentum should clarify structure, not replace it.
Minute 5-7: Check participation
Ask:
- Did volume confirm the move?
- Is the move happening during a liquid session?
- Is open interest rising or falling?
- Is funding neutral, cheap, or crowded?
- Did liquidations already clear one side?
This prevents a common BTC price analysis mistake: trusting a clean chart while the participation layer is weak.
Minute 7-9: Write the risk card
Your risk card should fit in five lines:
| Field | Example |
|---|---|
| Thesis | BTC continuation if reclaimed range high holds |
| Invalidation | Two closes back inside the old range |
| Max loss | Predefined before entry |
| Trigger | Retest holds with volume and neutral funding |
| Stand-down rule | Funding spikes while price fails retest |
If the card looks messy, the trade is messy.
Minute 9-10: Choose the lane
End every BTC price analysis session in one of four lanes:
- Act: Evidence aligns, invalidation is clear, and risk is acceptable.
- Watch: Setup is forming, but confirmation is missing.
- Research: Signals conflict or source quality is weak.
- Stand down: Risk is unclear, leverage is crowded, or the setup is outside your plan.
That final lane is the difference between analysis and entertainment.
The BTC price analysis decision card
Use this template before taking action:
btc_price_analysis_card
decision:
timeframe:
current_structure:
key_support:
key_resistance:
momentum_read:
volume_liquidity_read:
derivatives_read:
tail_risk:
invalidation:
max_loss:
action_lane: act | watch | research | stand_down
next_review_time:
The best BTC price analysis records what you saw before the outcome. That makes it possible to audit whether your process works instead of only remembering the winning trades. If sentiment is part of the read, connect the card to a BTC sentiment analysis workflow playbook rather than treating mood as a price signal.
Common BTC price analysis mistakes
Mistake 1: Starting with an opinion
If you begin with "I think BTC is going up," every chart can become evidence. Start with the decision, not the opinion.
Mistake 2: Treating indicators as votes
RSI, MACD, moving averages, volume, funding, and open interest are not equal votes in a poll. They answer different questions. A momentum signal cannot replace a liquidity check. A support zone cannot replace a risk budget.
Mistake 3: Ignoring timeframes
A bullish five-minute setup can exist inside a bearish daily structure. BTC price analysis should state the timeframe clearly, or the conclusion is incomplete.
Mistake 4: Forgetting fees, slippage, and spread
A chart setup can look attractive before execution costs. If the expected move is small and the market is thin, fees and slippage can erase the edge.
Mistake 5: Moving invalidation after entry
The invalidation level is not a suggestion. If the reason for the trade fails, the analysis has failed. Changing the level after price moves against you turns the process into hope.
Mistake 6: Confusing risk warnings with bearish calls
Risk context is not the same as a bearish view. A good BTC price analysis workflow can say: "Trend is up, but leverage is crowded, so reduce size or wait for a reset."
Where BTCMind fits
BTCMind is built for traders who want BTC price analysis without manually stitching together every chart, indicator, derivatives screen, and risk note. The app runs a six-agent research council: technicals, derivatives, tail-risk, historical reflection, bull researcher, bear researcher, and portfolio-manager synthesis. The output is an investment-grade brief on mobile with verdict, key levels, action plan, invalidation, and confidence.
That matters because BTC price analysis is rarely just a chart problem. A useful read needs technical structure, counterarguments, derivatives context, and a risk boundary. BTCMind's role is to compress that process into a traceable brief so the user can read the conclusion, inspect the evidence, and decide whether to act.
It is still not a guarantee, and it is not investment advice. It is a decision workflow.
If you are already comparing vendors, read the sibling guide: BTC price analysis comparison.
Final takeaway
BTC price analysis matters when Bitcoin movement could change your exposure, risk, or timing. It is most valuable near major levels, after breakouts or breakdowns, when momentum conflicts with price, before leverage, after news, and during portfolio reviews.
The practical rule is simple: if the decision matters, write the card. Define the structure, confirm or reject momentum, check participation, set invalidation, and choose one lane: act, watch, research, or stand down.
That is how BTC price analysis becomes useful. It stops being a forecast and becomes a repeatable decision system.